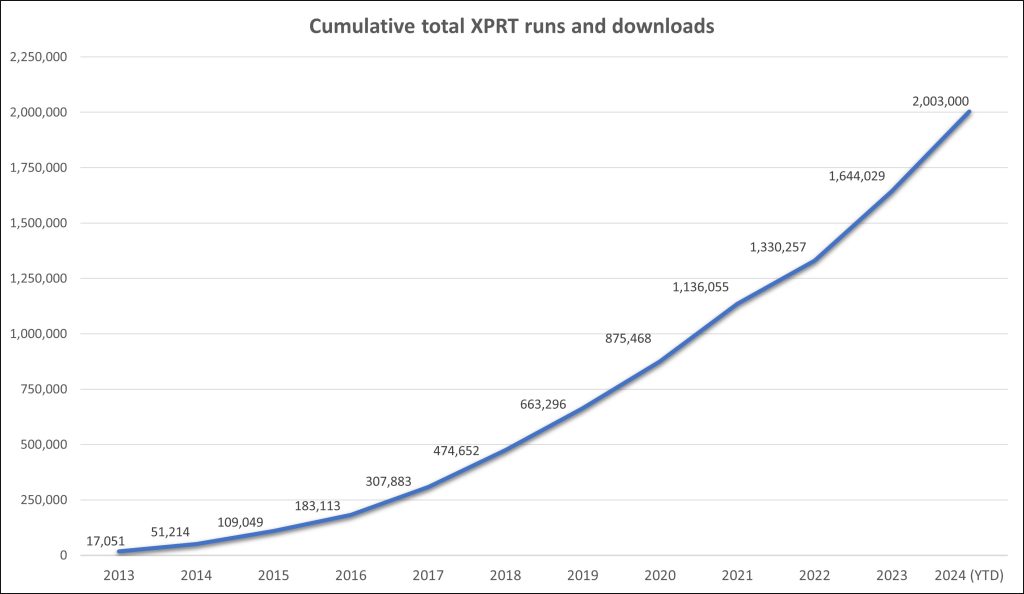
As we near the end of 2024, we’re excited to share that the XPRTs have passed another notable milestone—over 2,000,000 combined runs and downloads! The rate of growth in the total number of XPRT runs and downloads is exciting. It took about seven and a half years for the XPRTs to pass one million total runs and downloads—but it’s taken less than half that, three and a half years, to add another million. Figure 1 shows the climb to the two-million-run mark.
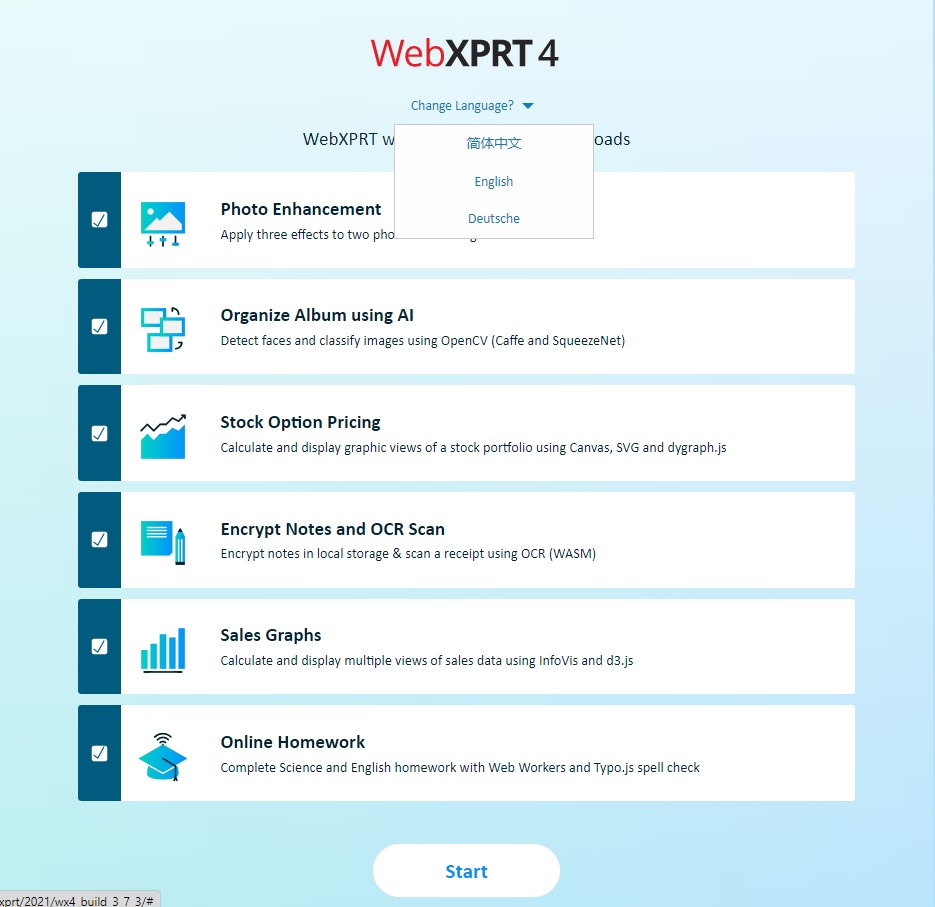
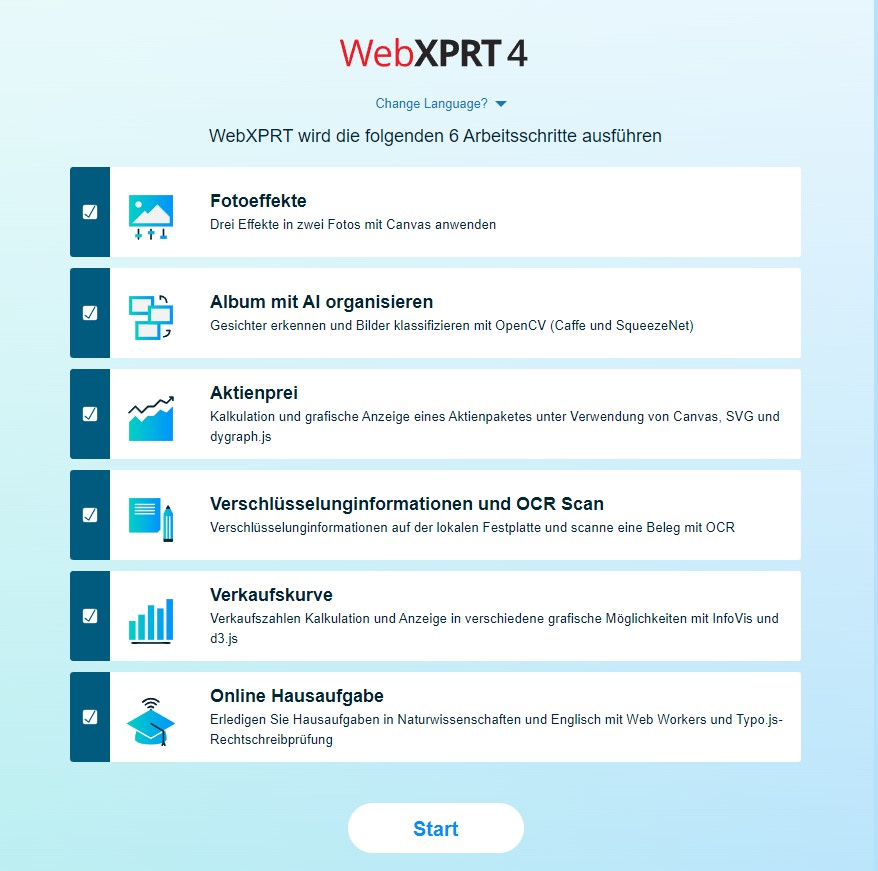
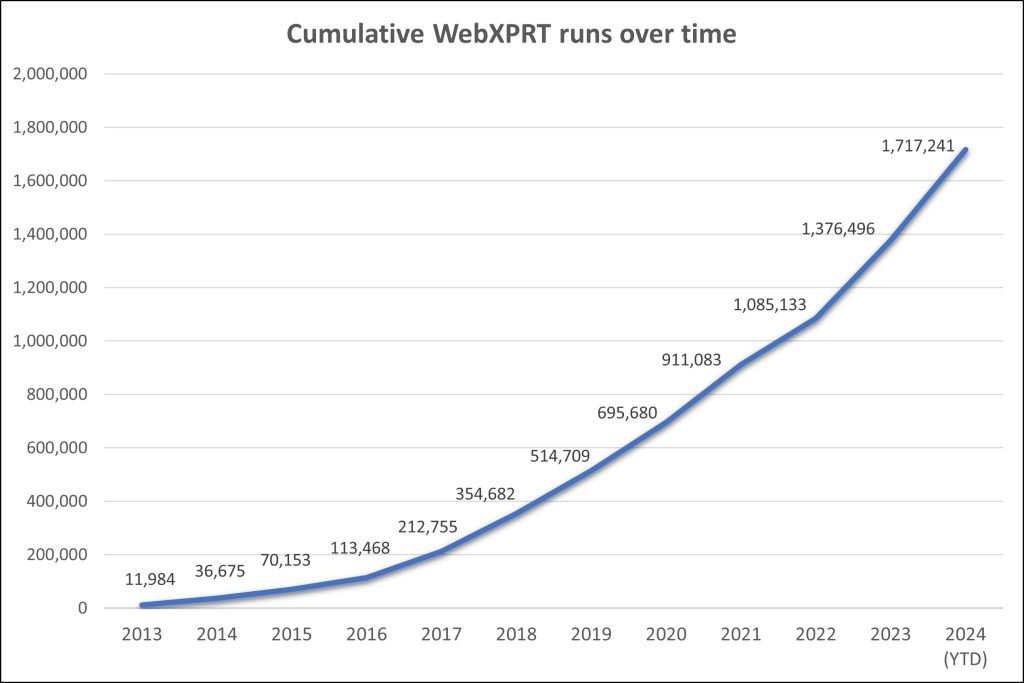
As you would expect, most of the runs contributing to that total come from WebXPRT tests. If you’ve run WebXPRT in any of the 983 cities and 84 countries from which we’ve received completed test data—including newcomers El Salvador, Malaysia, Morocco, and Saudi Arabia—we’re grateful for your help in reaching this milestone! As Figure 2 illustrates, WebXPRT use has grown steadily since the debut of WebXPRT 2013. On average, we now record more than twice as many WebXPRT runs each month than we recorded in WebXPRT’s entire first year. With over 340,000 runs so far in 2024—an increase of more than 16 percent over last year’s total—that growth is showing no signs of slowing down.
This milestone isn’t just about numbers. Establishing and maintaining a presence in the industry and experiencing year-over-year growth requires more than technical know-how and marketing efforts. It requires the ongoing trust and support of the benchmarking community—including OEM labs, the tech press, and independent computer enthusiasts—and those who simply want to know how good their devices are at web browsing.
Once again, we’re thankful for the support of everyone who’s used the XPRTs over the years, and we look forward to another million!
If you have any questions or comments about any of the XPRTs, we’d love to hear from you!
Justin