BenchmarkXPRT Blog banner

Tag Archives: XPRTs

Shopping for back-to-school tech? The XPRTs can help!

For many students, the first day of school is just around the corner, and it’s now time to shop for new tech devices that can help set them up for success in the coming year. The tech marketplace can be confusing, however, with so many brands, options, and competing claims to sort through.

Fortunately, the XPRTs are here to help!

Whether you’re shopping for a new phone, tablet, Chromebook, laptop, or desktop, the XPRTs can provide industry-trusted performance scores that can give you confidence that you’re making a smart purchasing decision.

The WebXPRT 4 results viewer is a good place to start looking for device scores. The viewer displays WebXPRT 4 scores from over 700 devices—including many of the latest releases—and we’re adding new scores all the time. To learn more about the viewer’s capabilities and how you can use it to compare devices, check out this blog post.

Another resource we offer is the XPRT results browser. The browser is the most efficient way to access the XPRT results database, which currently holds more than 3,700 test results from over 150 sources, including major tech review publications around the world, manufacturers, and independent testers. It offers a wealth of current and historical performance data across all the XPRT benchmarks and hundreds of devices. You can read more about how to use the results browser here.

Also, if you’re considering a popular device, there’s a good chance that a recent tech review includes an XPRT score for that device. There are two quick ways to find these reviews: You can either (1) search for “XPRT” on your preferred tech review site or (2) use a search engine and input the device name and XPRT name, such as “Dell XPS” and “WebXPRT.”

Here are a few recent tech reviews that use one of the XPRTs to evaluate a popular device:

Lastly, here at Principled Technologies, we frequently publish reports that evaluate the performance of hot new consumer devices, and many of those reports include WebXPRT scores. For example, check out our extensive testing of HP ZBook G10 mobile workstations or our detailed comparison of Lenovo ThinkPad, ThinkBook, and ThinkCentre devices to their Apple Mac counterparts.

The XPRTs can help anyone stuck in the back-to-school shopping blues make better-informed and more confident tech purchases. As this new school year begins, we hope you’ll find the data you need on our site or in an XPRT-related tech review. If you have any questions about the XPRTs, XPRT scores, or the results database please feel free to ask!

Justin

Putting together a good WebXPRT workload proposal

Recently, we announced that we’re moving forward with the development of a new AI-focused WebXPRT 4 workload. It will be an auxiliary workload, which means that it will run as a separate, optional test, and it won’t affect existing WebXPRT 4 tests or scores. Although the inspiration for this new workload came from internal WebXPRT discussions—and, let’s face it, from the huge increase in importance of AI–we wanted to remind you that we’re always open to hearing your WebXPRT workload ideas. If you’d like to submit proposals for new workloads, you don’t have to follow a formal process. Just contact us, and we’ll start the conversation.

If you do decide to send us a workload proposal, it will be helpful to know the types of parameters that we keep in mind. Below, we discuss some of the key questions we ask when we evaluate new WebXPRT workload ideas.

Will it be relevant and interesting to real users, lab testers, and tech reviewers?

When considering a WebXPRT workload proposal, the first two criteria are simple: is it relevant in real life, and are people interested in the workload? We created WebXPRT to evaluate device performance using web-based tasks that consumers are likely to experience daily, so real-life relevance has always been an essential requirement for us throughout development. There are many technologies, functions, and use cases that we could test in a web environment, but only some are relevant to common applications or usage patterns and are likely to draw the interest of real users, lab testers, and technical reviewers.

Will it have cross-platform support?

Currently, WebXPRT runs on almost any web browser and almost every device that supports a web browser. We would like to keep that level of cross-platform support when we introduce new workloads. However, technical differences in how various browsers execute tasks make it challenging to include certain scenarios without undermining our cross-platform ideal. When considering any workload proposal, one of the first questions we ask is, “Will it work on all the major browsers and operating systems?”

There are special exceptions to this guideline. For instance, we’re still in the early days of browser-based AI, and it’s unlikely that a new browser-based AI workload will run on every major browser. If it’s a particularly compelling idea, such as the AI scenario we’re currently working on, we may consider including it as an auxiliary test.

Will it differentiate performance between different types of devices?

XPRT benchmarks provide users with accurate measures for evaluating how well target systems or technologies perform specific tasks. With a broadly targeted benchmark like WebXPRT, if the workloads are so heavy that most devices can’t handle them or so light that most devices complete them without being taxed, the results will be of little use for helping buyers evaluating systems and making purchasing decisions, OEM labs, and the tech press.

That’s why, with any new WebXPRT workload, we look for a sweet spot with respect to how computationally demanding it will be. We want it to run on a wide range of devices—from low-end devices that are several years old to brand-new high-end devices, and everything in between. We also want users to see a wide range of workload scores and resulting overall scores that accurately reflect the experiences those systems deliver, so they can easily grasp the different performance capabilities of the devices under test.

Will results be consistent and easily replicated?

Finally, WebXPRT workloads should produce scores that consistently fall within an acceptable margin of error and are easily replicated with additional testing or comparable gear. Some web technologies are very sensitive to uncontrollable or unpredictable variables, such as internet speed. A workload that measures one of those technologies would be unlikely to produce results that are consistent and easily replicated.

We hope this post will be useful if you’re thinking about potential new workloads that you’d like to see in WebXPRT. If you have any general thoughts about browser performance testing or specific workload ideas that you’d like us to consider, please let us know.

Justin

Want to know how your device performs? Explore the XPRT results database

If you only recently started using the XPRT benchmarks, you may not know about one of the free resources we offer—the XPRT results database. Our results database currently holds more than 3,650 test results from over 150 sources, including global tech press outlets, OEM labs, and independent testers. It serves as a treasure trove of current and historical performance data across all the XPRT benchmarks and hundreds of devices. You can use these results and the results of the same XPRTs on your device to get a sense of how well your device performs.

We update the results database several times a week, adding selected results from our own internal lab testing, reliable media sources, and end-of-test user submissions. (After you run one of the XPRTs, you can choose to submit the results, but don’t worry—this is opt-in. Your results do not automatically appear in the database.) Before adding a result, we also look at any available system information and evaluate whether the score makes sense and is consistent with general expectations.

There are three primary ways that you can explore the XPRT results database.

The first is by visiting the main BenchmarkXPRT results browser, which displays results entries for all of the XPRT benchmarks in chronological order (see the screenshot below). You can filter the results by selecting a benchmark from the drop-down menu. You can also type values, such as a vendor name (e.g., Dell) or the name of a tech publication (e.g., PCWorld) into the free-form filter field. For results we’ve produced in our lab, clicking “PT” in the Source column takes you to a page with additional configuration information for the test system. For sources outside our lab, clicking the source name takes you to the original article or review that contains the result.

The second way to access our published results is by visiting the results page for an individual XPRT benchmark. Start by going to the page of the benchmark that interests you (e.g., CrXPRT.com) , and looking for the blue View Results button. Clicking the button takes you to a page that displays results for only that benchmark. You can use the free-form filter on the page to filter those results, and you can use the Benchmarks drop-down menu to jump to the other individual XPRT results pages.

The third way to view our results database is with the WebXPRT 4 results viewer. The viewer provides an information-packed, interactive tool with which you can explore data from the curated set of WebXPRT 4 results we’ve published on our site. We’ll discuss the features of the WebXPRT 4 results viewer in more detail in a future post.

You can use any of these approaches to compare the results of an XPRT on your device with our many published results. We hope you’ll take some time to explore the information in our results database and that it proves to be helpful to you. If you have ideas for new features or suggestions for improvement, we’d love to hear from you!

Justin

WebXPRT benchmarking tips from the XPRT lab

Occasionally, we receive inquiries from XPRT users asking for help determining why two systems with the same hardware configuration are producing significantly different WebXPRT scores. This can happen for many reasons, including different software stacks, but score variability can also result from different testing behaviors and environments. While some degree of variability is normal, these types of questions provide us with an opportunity to talk about some of the basic benchmarking practices we follow in the XPRT lab to produce the most consistent and reliable scores.

Below, we list a few basic best practices you might find useful in your testing. Most of them relate to evaluating browser performance with WebXPRT, but several of these practices apply to other benchmarks as well.

  • Hardware is not the only important factor: Most people know that different browsers produce different performance scores on the same system. Testers are not, however, always aware of shifts in performance between different versions of the same browser. While most updates don’t have a large impact on performance, a few updates have increased (or even decreased) browser performance by a significant amount. For this reason, it’s always important to record and disclose the extended browser version number for each test run. The same principle applies to any other relevant software.
  • Keep a thorough record of system information: We record detailed information about a test system’s key hardware and software components, including full model and version numbers. This information is not only important for later disclosure if we choose to publish a result, it can also sometimes help to pinpoint system differences that explain why two seemingly identical devices are producing very different scores. We also want people to be able to reproduce our results to the closest extent possible, so that commitment involves recording and disclosing more detail than you’ll find in some tech articles and product reviews.
  • Test with clean images: We typically use an out-of-box (OOB) method for testing new devices in the XPRT lab. OOB testing means that other than running the initial OS and browser version updates that users are likely to run after first turning on the device, we change as little as possible before testing. We want to assess the performance that buyers are likely to see when they first purchase the device and before they install additional software. This is the best way to provide an accurate assessment of the performance retail buyers will experience from their new devices. That said, the OOB method is not appropriate for certain types of testing, such as when you want to compare as close to identical system images as possible, or when you want to remove as much pre-loaded software as possible.
  • Turn off automatic updates: We do our best to eliminate or minimize app and system updates after initial setup. Some vendors are making it more difficult to turn off updates completely, but you should always double-check update settings before testing.
  • Get a baseline for system processes: Depending on the system and the OS, a significant amount of system-level activity can be going on in the background after you turn it on. As much as possible, we like to wait for a stable baseline (idle time) of system activity before kicking off a test. If we start testing immediately after booting the system, we often see higher variance in the first run before the scores start to tighten up.
  • Use more than one data point: Because of natural variance, our standard practice in the XPRT lab is to publish a score that represents the median from three to five runs, if not more. If you run a benchmark only once and the score differs significantly from other published scores, your result could be an outlier that you would not see again under stable testing conditions or over the course of multiple runs.


We hope these tips will help make your testing more accurate. If you have any questions about WebXPRT, the other XPRTs, or benchmarking in general, feel free to ask!

Justin

Let the XPRTs be your holiday shopping companion!

The holiday shopping season is right around the corner, and choosing the right tech gift can be a daunting task. If you’re considering new phones, tablets, Chromebooks, laptops, or desktops as gifts this year, and are unsure where to get reliable device information, the XPRTs can help!

The XPRTs provide objective, reliable measures of a device’s performance that can help cut through competing marketing claims. For example, instead of guessing whether the performance of a new phone justifies its price, you can use its WebXPRT performance score to see how it stacks up against both older models and competitors while tackling everyday tasks.

A good place to start looking for device scores is our XPRT results browser, which lets you access our database of more than 3,500 test results from over 165 sources, including major tech review publications around the world, OEMs, and independent testers. You can find a wealth of current and historical performance data across all the XPRT benchmarks and hundreds of devices. Learn how to use the results browser here.

If you’re considering a popular device, chances are good that a recent tech review includes an XPRT score for it. Go to your favorite tech review site and search for “XPRT,” or enter the name of the device and the appropriate XPRT (e.g., “Pixel” and “WebXPRT”) in a search engine. Here are a few recent tech reviews that used the XPRTs to evaluate popular devices:


The XPRTs can help consumers make better-informed and more confident tech purchases this holiday season, and we hope you’ll find the data you need on our site or in an XPRT-related tech review. If you have any questions about the XPRTs, XPRT scores, or the results database please feel free to ask!

Justin

We have a new XPRTs around the world infographic!

If you’ve followed the XPRT blog for a while, you know that we occasionally update the community on some of the reach metrics we track by publishing a new version of the “XPRTs around the world” infographic. The metrics we track include completed test runs, benchmark downloads, and mentions of the XPRTs in advertisements, articles, and tech reviews. Gathering this information gives us insight into how many people are using the XPRT tools, and updating the infographic helps readers and community members see the impact the XPRTs are having around the world.

This week, we published a new infographic, which includes the following highlights:

  • The XPRTs have been mentioned more than 19,500 times on over 4,000 unique sites.
  • Those mentions include more than 12,300 articles and reviews.
  • Users have tested gear with the XPRTs in over 924 cities located in 81 countries on six continents. New cities of note include Dhaka, Bangladesh; Zagreb, Croatia; Hamilton, New Zealand; and Medina, Saudi Arabia.

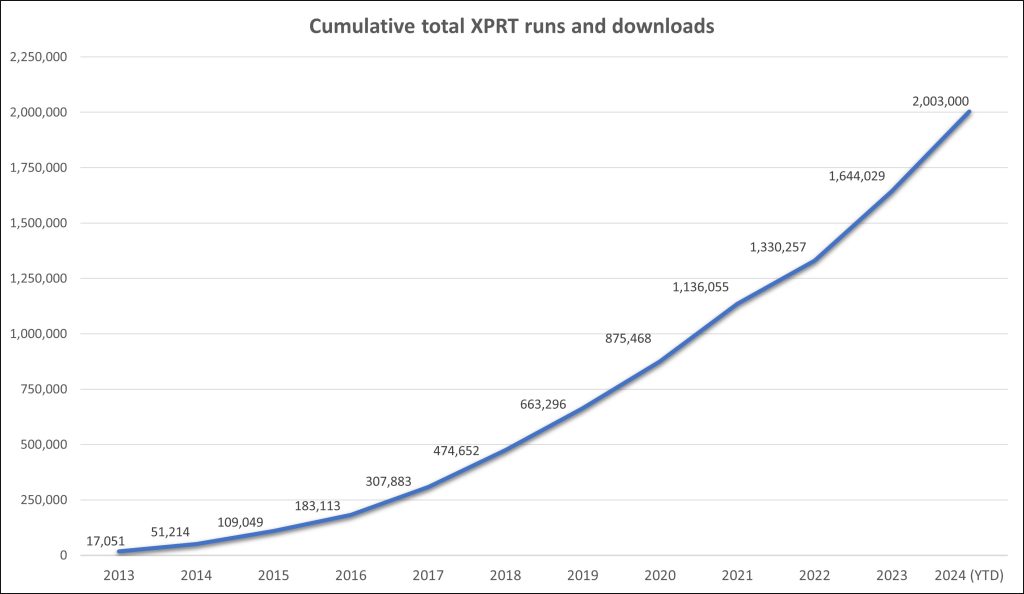
In addition to the reach metrics we mention above, the XPRTs have now delivered more than 1,330,000 real-world results! We’re grateful for everyone who’s helped us get this far. Your participation is vital to our achieving our goal: to provide benchmark tools that are reliable, relevant, and easy to use.

Justin

Check out the other XPRTs:

Forgot your password?