Development work on the next version of WebXPRT is well underway, and we think it’s a good time to offer a glimpse of what’s to come.
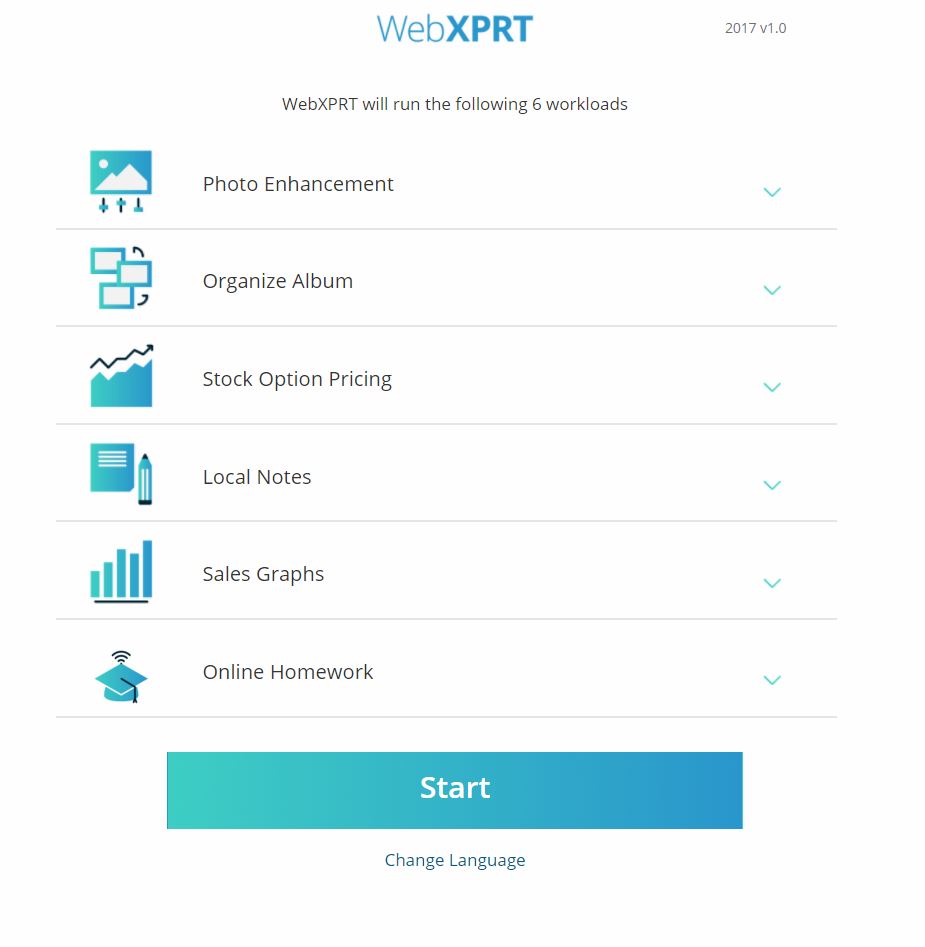
We’ve updated the photo-related workloads with new images and are experimenting with adding a new task to the Organize Album workload. The task utilizes ConvNetJS, a JavaScript library designed for training neural networks within the browser itself, to assign classifications to a set of images. It’s an example of the type of integrated deep learning tasks that will be showing up in all sorts of devices in the years to come.
We’re also testing an additional task in the Local Notes workload using Tesseract.js, a popular OCR (optical character recognition) engine. Our scenario uses OCR technology to scan images of purchase receipts and gather relevant information.
We’re testing these new tasks now, and will include them only once we’re confident that they produce consistent and reliable results without extending the benchmark’s runtime unnecessarily. Consequently, the next WebXPRT might contain variations of these tasks, or other new technologies altogether. We mention them now to offer some insight into the types of workload enhancements that we’re considering.
We’ve been working hard on the new WebXPRT UI as well. The image below shows the new start page from an early development build. We’re still making adjustments, so the final product will probably differ, but you do get a sense of the new UI’s clean look.
As we’ve said before, we’re committed to making sure that WebXPRT runs in most browsers and produces results that are useful for comparing web browsing performance across a wide variety of devices. We appreciate the feedback we’ve gotten so far, and are happy to receive more. Do you have ideas for the next WebXPRT? Let us know!
Justin