We’re excited
to announce that the WebXPRT 4 Preview is now available! Testers can access the
Preview at www.WebXPRT4.com or through a link on WebXPRT.com. The Preview is available to everyone, and testers can now
publish scores from Preview build testing. We may still tweak a few things, but
will limit any changes that we make between the Preview and the final release
to the UI and features we do not expect to affect test scores.
Longtime
WebXPRT users will notice that the WebXPRT 4 Preview has a new, but familiar,
UI. The general process for kicking off both manual and automated tests is the
same as with WebXPRT 3, so the transition from WebXPRT 3 to WebXPRT 4 testing
should be straightforward. We encourage everyone to visit the XPRT blog for more details about what’s new in this Preview release.
In addition, keep
your eye on the blog for more details about the all-new WebXPRT
4 results viewer, which we expect to publish in the very near future. We think
WebXPRT testers will enjoy using the viewer to explore our WebXPRT 4 test data!
After you try the WebXPRT 4 Preview, please send us your comments. Thanks and happy testing!
People choose a default web browser based on several factors.
Speed is sometimes the deciding factor, but privacy settings, memory load,
ecosystem integration, and web app capabilities can also come into play.
Regardless of the motivations behind a person’s go-to browser choice, the
dominance of software-as-a-service (SaaS) computing means that new updates are
always right around the corner. In previous blog posts, we’ve talked about how browser speed can increase
or decrease significantly after an update, only to swing back in the other
direction shortly thereafter. OS-specific optimizations can also affect
performance, such as with Microsoft Edge on Windows and Google Chrome on Chrome
OS.
Windows 11 began rolling out earlier this month, and tech press outlets
such as AnandTech and PCWorld have used WebXPRT
3 to evaluate the impact of the new OS—or
specific settings in the OS—on browser performance. Our own in-house tests, which
we discuss below, show a negligible impact on browser performance when updating
our test system from Windows 10 to Windows 11. It’s important to note that depending
on a system’s hardware setup, the impact might be more significant in certain
scenarios. For more information about such scenarios, we encourage you to read the
PCWorld article discussing the impact of the Windows 11 default virtualization-based
security (VBS) settings on
browser performance in some instances.
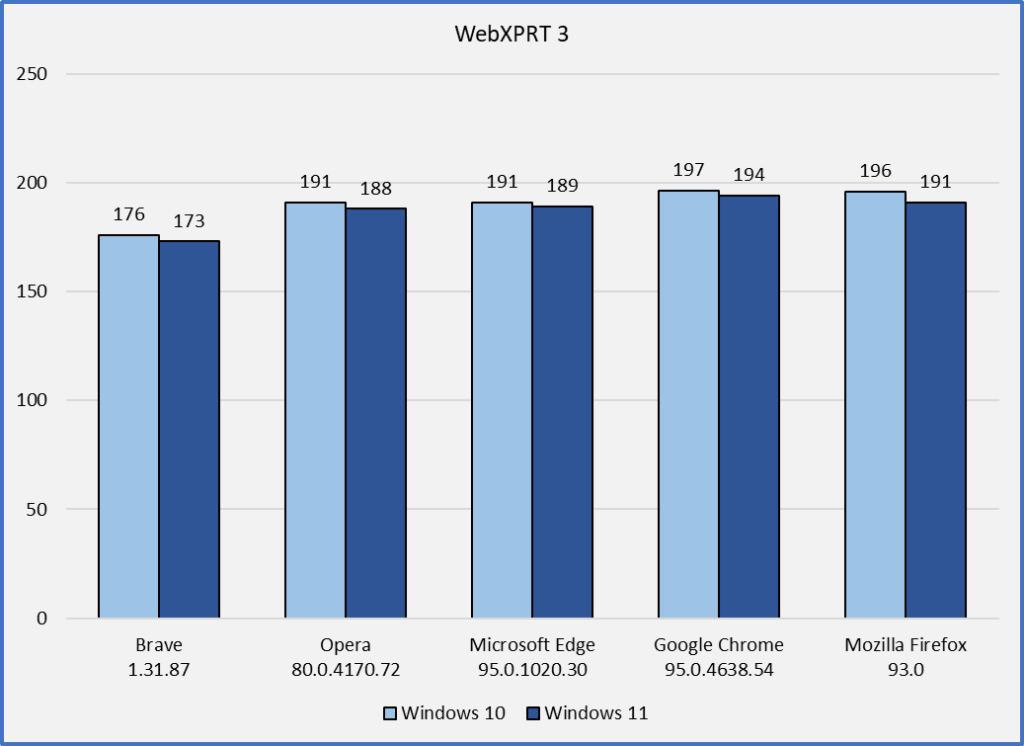
In our comparison tests, we used a Dell
XPS 13 7930 with an Intel
Core i3-10110U processor and 4 GB of RAM. For the Windows 10 tests, we used a
clean Windows 10 Home image updated to version 20H2 (19042.1165). For the
Windows 11 tests, we updated the system to Windows 11 Home version 21H2 (22000.282).
On each OS version, we ran WebXPRT 3 three times on the latest versions of five
browsers: Brave, Google Chrome, Microsoft Edge, Mozilla Firefox, and Opera. For
each browser, the score we post below is the median of the three test runs.
In our last
round of tests on Windows 10, Firefox was the clear winner. Three of the
Chromium-based browsers (Chrome, Edge, and Opera) produced very close scores,
and the performance of Brave lagged by about 7 percent. In this round of
Windows 10 testing, performance on every browser improved slightly, with Google
Chrome taking a slight lead over Firefox.
In our Windows 11 testing, we were interested to find that without exception, browser scores were slightly lower than in Windows 10 testing. However, none of the decreases were statistically significant. Most users performing daily tasks are unlikely to notice that degree of difference.
Have you observed any significant differences in WebXPRT 3 scores
after upgrading to Windows 11? If so, let us know!
Last
week, we shared some new details
about the changes we’re likely to make in WebXPRT 4, and a rough target date
for publishing a preview build. This week, we’re excited to share an early
preview of the new results viewer tool that we plan to release in conjunction
with WebXPRT 4. We hope the tool will help testers and analysts access the
wealth of WebXPRT test results in our database in an efficient, productive, and
enjoyable way. We’re still ironing out many of the details, so some aspects of
what we’re showing today might change, but we’d like to give you an idea of
what to expect.
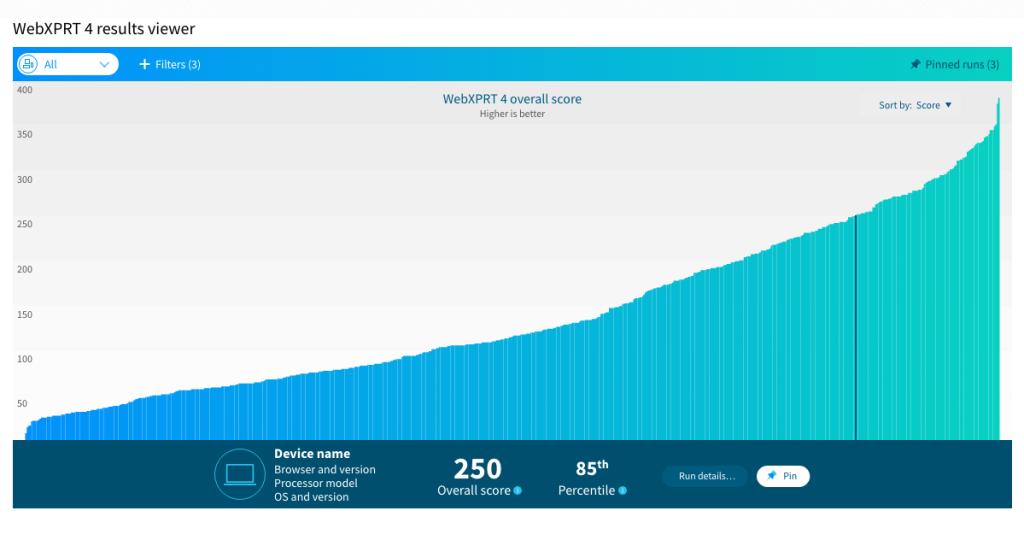
The screenshot below shows the tool’s default display. In this example, the viewer displays over 650 sample results—from a wide range of device types—that we’re currently using as placeholder data. The viewer will include several sorting and filtering options, such as device type, hardware specs such as browser type and processor vendor, the source of the result, etc.
Each
vertical bar in the graph represents the overall score of single test result,
and the graph presents the scores in order from lowest to highest. To view an
individual result in detail, the user simply hovers over and selects the bar
representing the result. The bar turns dark blue, and the dark blue banner at
the bottom of the viewer displays details about that result.
In the example above, the banner shows the overall score (250) and the score’s percentile rank (85th) among the scores in the current display. In the final version of the viewer, the banner will also display the device name of the test system, along with basic hardware disclosure information. Selecting the Run details button will let users see more about the run’s individual workload scores.
We’re
still working on a way for users to pin or save specific runs. This would let
users easily find the results that interest them, or possibly select multiple
runs for a side-by-side comparison.
We’re excited about this new tool, and we look forward to sharing more details here in the blog as we get closer to taking it live. If you have any questions or comments about the results viewer, please feel free to contact us!
In November, we published our WebXPRT 3 browser performance comparison,
so we decided it was time to see if the performance rankings of popular
browsers have changed in the last nine months.
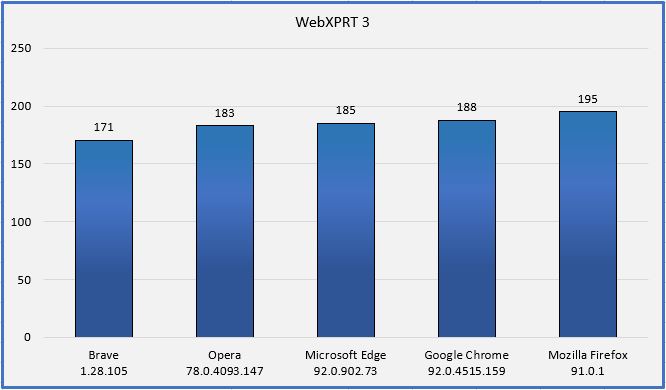
For this round of tests, we used the same laptop as last time:
a Dell
XPS 13 7930 with an Intel
Core i3-10110U processor and 4 GB of RAM running Windows 10 Home, updated to
version 1909 (18363.1556). We installed all current Windows updates and tested
on a clean system image. After the update process completed, we turned off
updates to prevent them from interfering with test runs. We ran WebXPRT 3 three
times each on five browsers: Brave, Google Chrome, Microsoft Edge, Mozilla Firefox,
and Opera. For each browser, the score we post below is the median of the three
test runs.
In our last
round of tests, the four
Chromium-based browsers (Brave, Chrome, Edge, and Opera) produced very close scores,
though we saw about a four percent lower score from Brave. In this round
of testing, performance improved for all four of the Chromium-based browsers.
Chrome, Edge, and Opera still produced very close scores, but Brave’s
performance still lagged, this time by about seven percent.
Firefox separated itself from the pack with a much higher score
and has been the clear winner in all three rounds of testing. During our second
round of testing in November, every browser except for Chrome saw slightly slower
performance than the first
round. In these latest tests, all the
Chromium-based browsers produced significantly higher scores than the second
round. When discussing browser performance, it’s important to remember that there
are many possible reasons for these performance changes—including changes in browser
overhead or changes in Windows—and most users may not notice the changes during
everyday tasks.
Do these results mean that
Mozilla Firefox will always provide you with a speedier web experience? As we
noted in previous comparisons, a device with a higher WebXPRT score will
probably feel faster during daily use than one with a lower score. For comparisons
on the same system, however, the answer depends on several factors, such as the
types of things you do on the web, how the extensions you’ve installed affect
performance, how frequently the browsers issue updates and incorporate new web
technologies, and how accurately each browser’s default installation settings
reflect how you would set up that browser for your daily workflow.
In addition, browser speed can
increase or decrease significantly after an update, only to swing back in the
other direction shortly thereafter. OS-specific optimizations can also affect
performance, such as with Edge on Windows 10 or Chrome on Chrome OS. All these
variables are important to keep in mind when considering how browser
performance comparison results translate to your everyday experience.
Do you have insights
you’d like to share from using WebXPRT to compare browser performance? Let us know!
As we move forward with the WebXPRT 4 development
process, we’re also working on ways to enhance the value of WebXPRT beyond simply
updating the benchmark. Our primary goal is to expand and improve the WebXPRT-related
tools and resources we offer at WebXPRT.com, starting with a new results
viewer.
Currently, users can view
WebXPRT results on our site two primary ways, each of which has advantages and
limitations.
The first way is the WebXPRT results viewer, which includes hundreds of
PT-curated performance scores from a wide range of trusted sources and devices.
Users can sort entries by device type, device name, device model, overall
score, date of publication, and source. The viewer also includes a free-form
filter for quick, targeted searches. While the results viewer contains a wealth
of information, it does not give users a way to use graphs or charts for
viewing and comparing multiple results at once. Another limitation of the
current results viewer is that it offers no easy way for users to access the
additional data about the test device and the subtest scores that we have for
many entries.
The second way to view WebXPRT
results on our site is the WebXPRT Processor Comparison
Chart. The
chart uses horizontal bar graphs to compare test scores from the hundreds of
published results in our database, grouped by processor type. Users can click
the average score for a processor to view all the WebXPRT results we currently
have for that processor. The visual aspect of the chart and its automated
“group by processor type” feature are very useful, but it lacks the sorting and
filtering capabilities of the viewer, and navigating to the details of
individual tests takes multiple clicks.
In the coming months, we’ll be working to combine the best features of the results viewer and the comparison chart into a single powerful WebXPRT results database tool. We’ll also be investigating ways to add new visual aids, navigation controls, and data-handling capabilities to that tool. We want to provide a tool that helps testers and analysts access the wealth of WebXPRT test information in our database in an efficient, productive, and enjoyable way. If you have ideas or comments about what you’d like to see in a new WebXPRT results viewing tool, please let us know!
In May, we surveyed
longtime WebXPRT users regarding the types of changes they would like to see in
a WebXPRT 4. We sent the survey to journalists at several tech press outlets,
and invited our blog readers to participate as well. We received some very helpful feedback. As we explore new possibilities for WebXPRT 4, we’ve decided to
open an updated version of the survey. We’ve adjusted the questions a bit based
on previous feedback and added some new ones, so we invite you to respond even
if you participated in the original survey.
Would you like to see a workload based on Motion UI in WebXPRT 4? Why or why not?
Would you like to see us include any other web technologies in additional workloads?
Are you happy with the WebXPRT 3 user interface? If not, what UI changes would you like to see?
Have you ever experienced significant connection issues when testing with WebXPRT?
Given its array of workloads, do you think the WebXPRT runtime is reasonable? Would you mind if the average runtime increased slightly?
Would you like to see us change any other aspects of WebXPRT 3?
If you would like to share your thoughts on any topics that the questions above do not cover, please include those in your response. We look forward to hearing from you!
Cookie Notice: Our website uses cookies to deliver a smooth experience by storing logins and saving user information. By continuing to use our site, you agree with our usage of cookies as our privacy policy outlines.