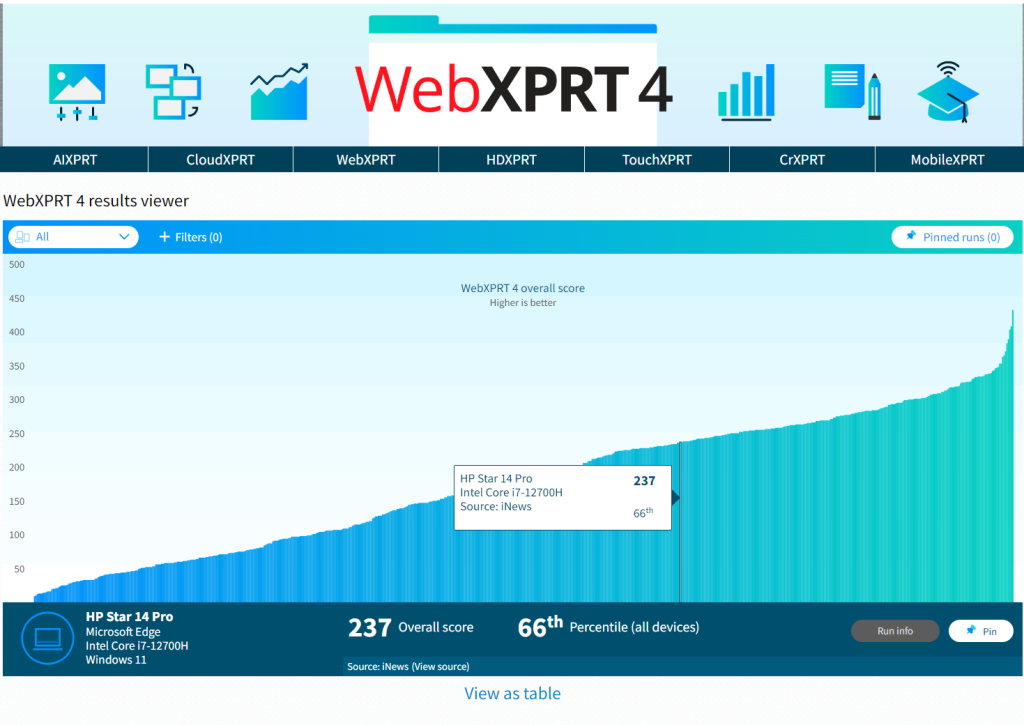
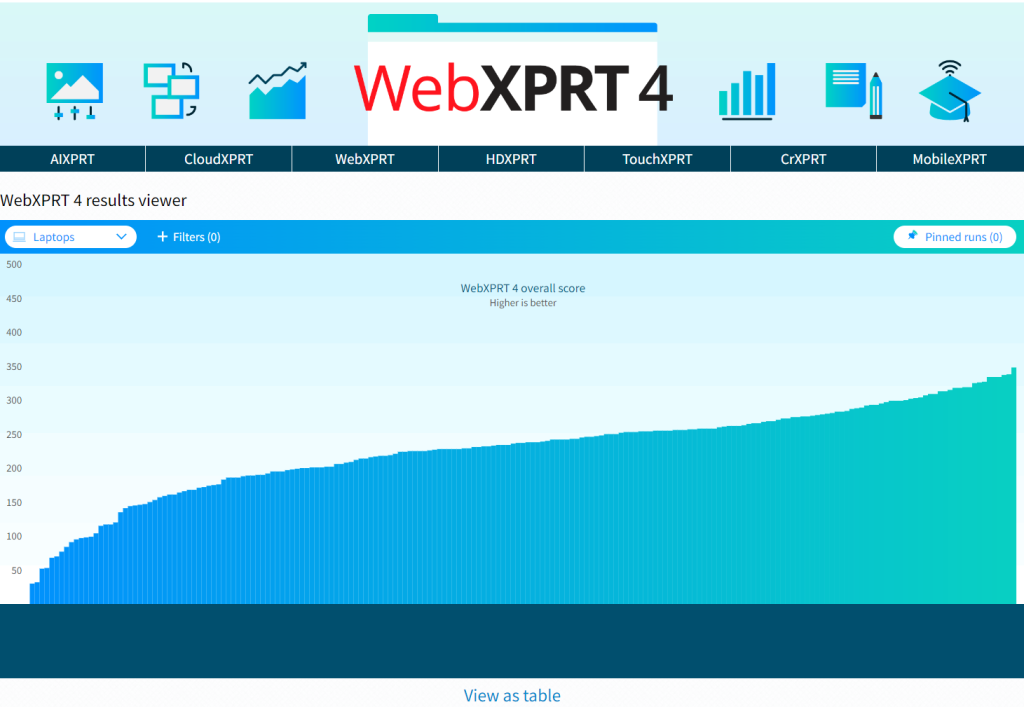
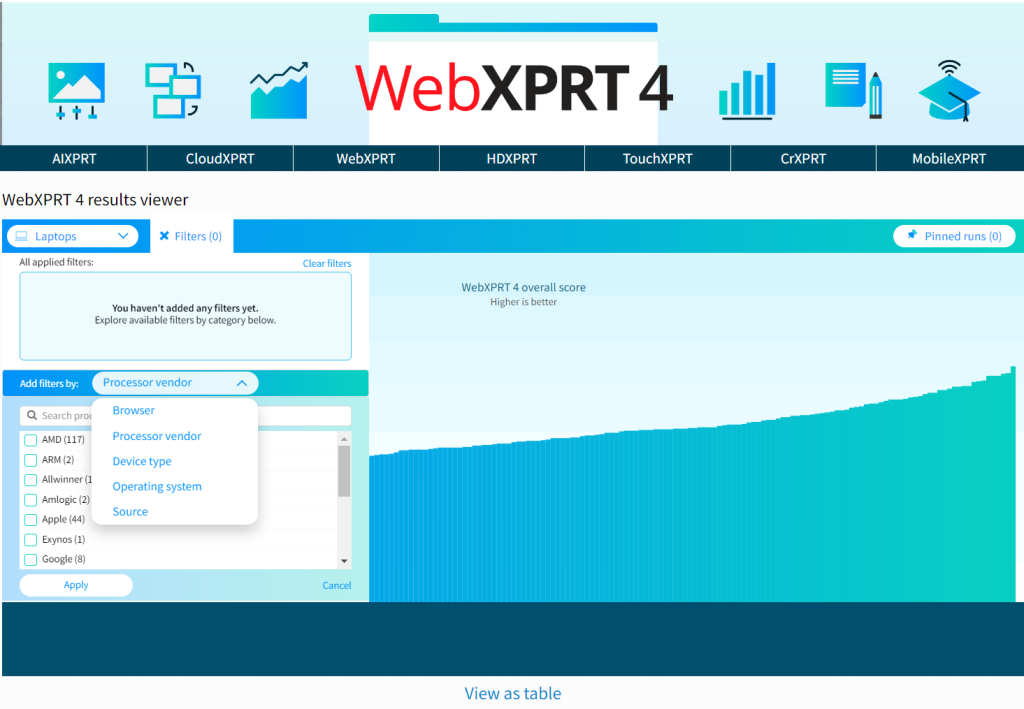
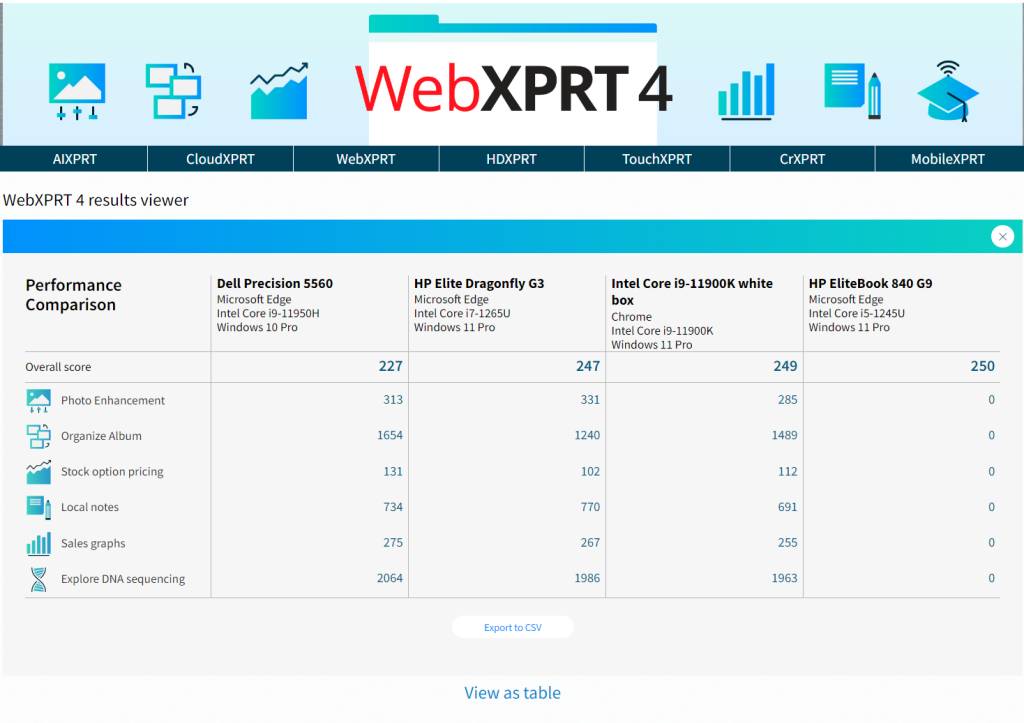
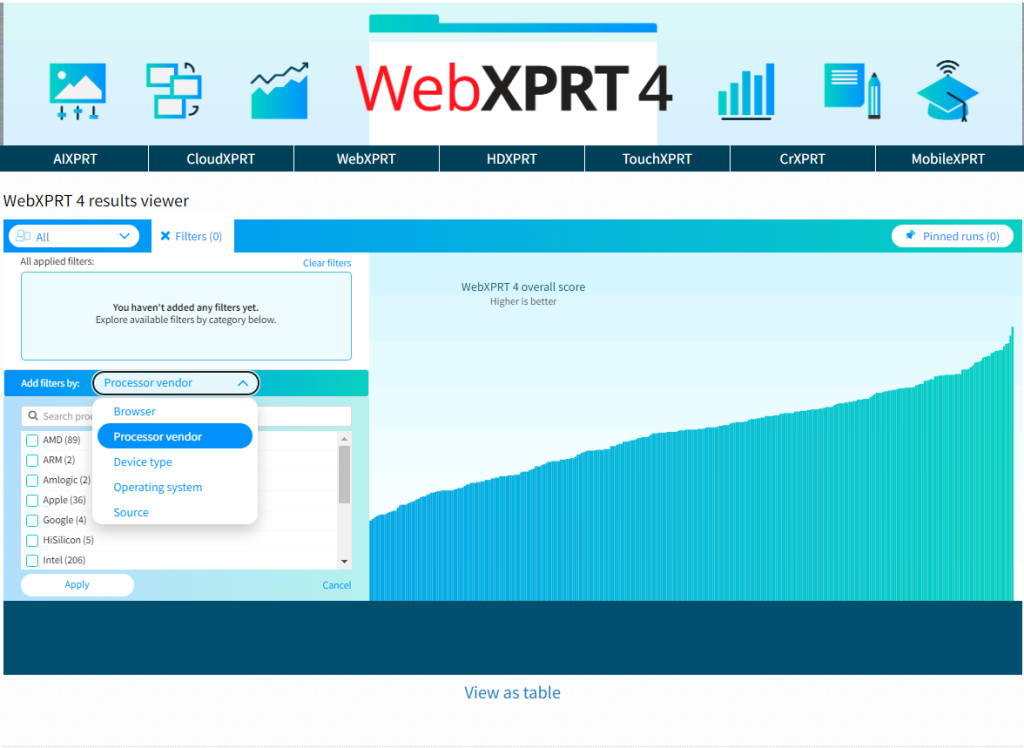
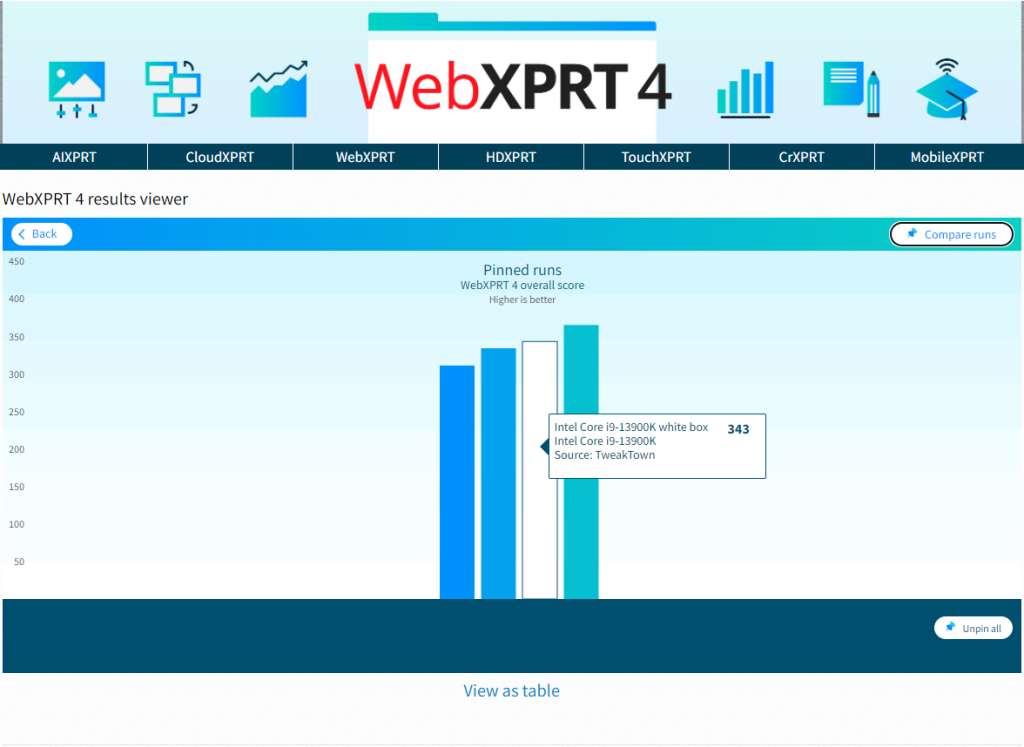
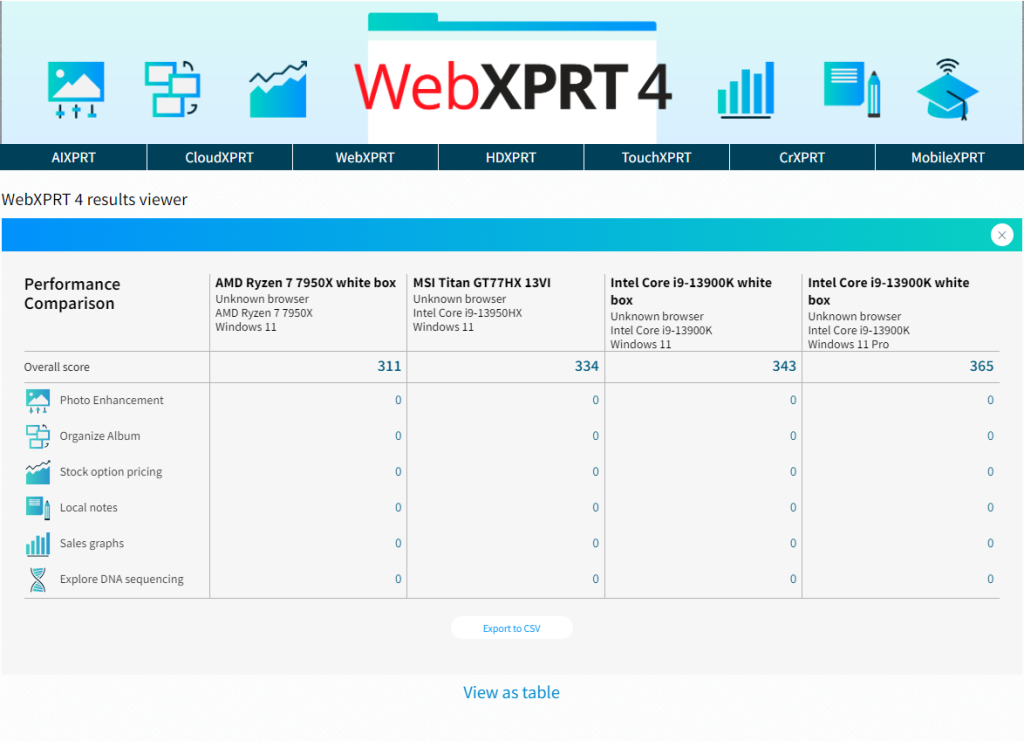
In a recent post, we discussed some key features that the WebXPRT 4 results viewer tool has to offer. In today’s post, we’ll cover the straightforward process of submitting your WebXPRT 4 test results for possible publication in the viewer.
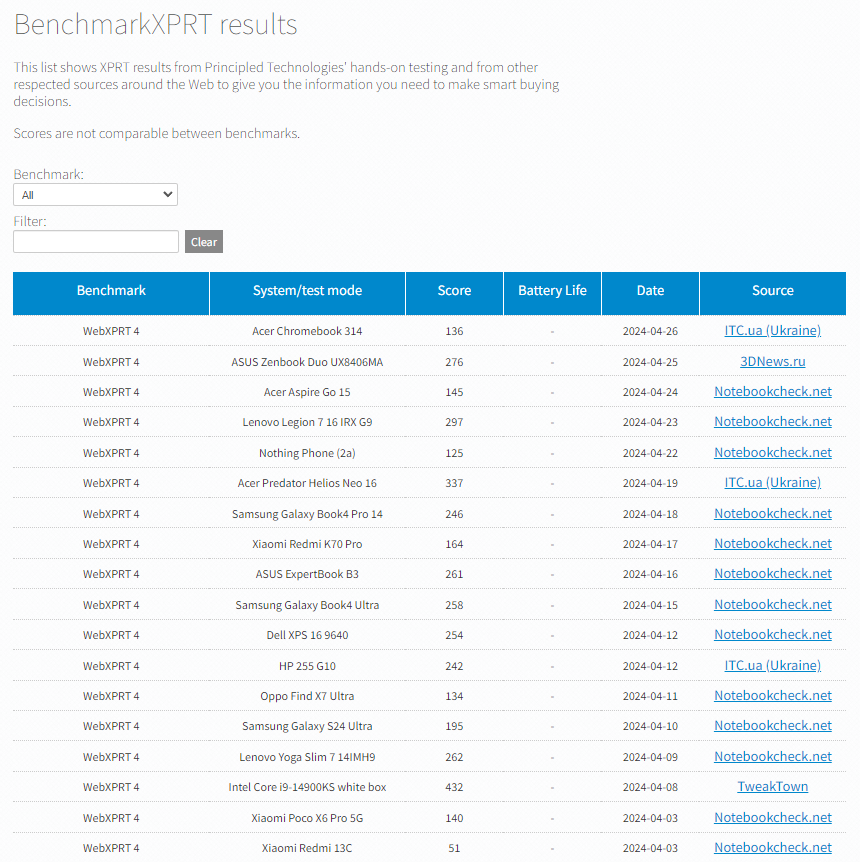
Unlike sites that publish all submissions, we publish only results that meet our evaluation criteria. Those results can come from OEM labs, third-party labs, reliable tech media sources, or independent user submissions. What’s important to us is that the scores must be consistent with general expectations, and for sources outside of our labs and data centers, they must include enough detailed system information that we can determine whether the score makes sense. That being said, if your scores are a little bit different from what you see in our database, please don’t hesitate to send them to us for consideration. It costs you nothing.
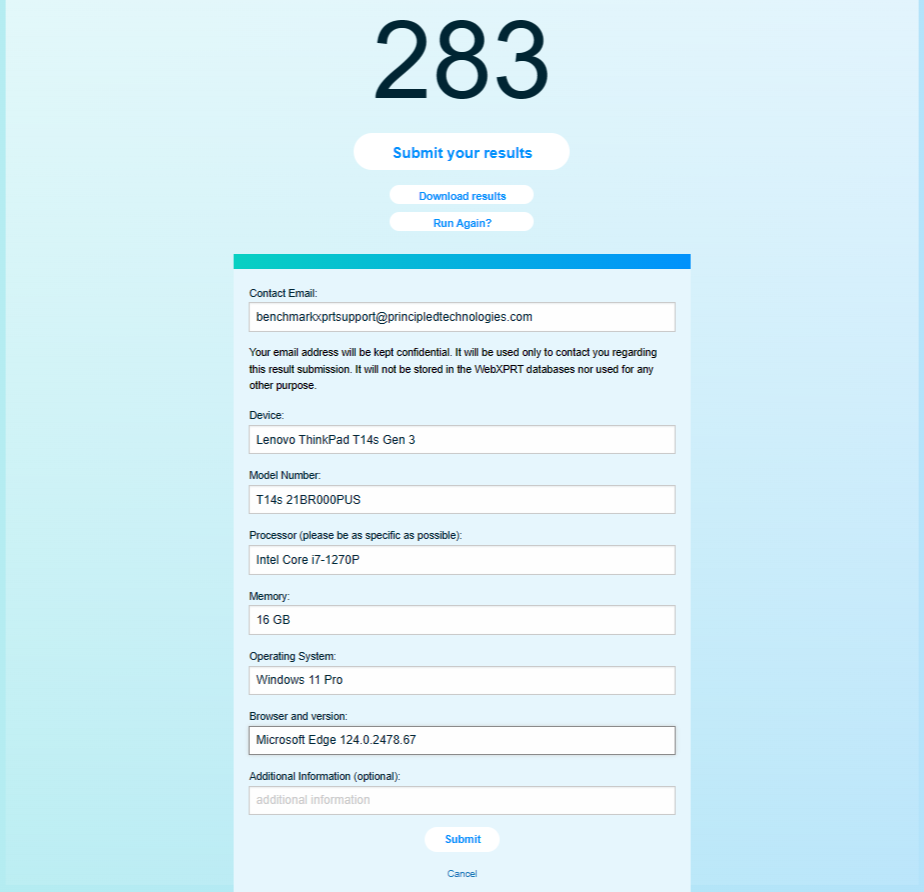
The actual result submission process is quick and easy. At the end of the WebXPRT test run, click the Submit your results button below the overall score, complete the short submission form, and click Submit again. Please be as specific as possible when filling in the system information fields. Detailed device information helps us assess whether individual scores represent valid test runs.
Figure 1 below shows how the form would look if I submitted a score at the end of a recent WebXPRT 4 run on one of the test systems here in our lab.
After you submit your score, we’ll contact you to confirm how we should display the source of the result in our database. You can choose one of the following:
- Your first and last name
- “Independent tester” (for users who wish to remain anonymous)
- Your company’s name, if you have permission to submit the result in their name. If you want to use a company name, please provide a valid company email address that corresponds with the company name.
As always, we will not publish any additional information about you or your company without your permission.
We look forward to seeing your scores! If you have questions about WebXPRT 4 testing or results submission, please let us know!
Justin