Over the past few weeks, we’ve discussed several of the key configuration variables in AIXPRT, such as batch size and level of precision. Today, we’re discussing another key variable: number of concurrent instances. In the context of machine learning inference, this refers to how many instances of the network model (ResNet-50, SSD-MobileNet, etc.) the benchmark runs simultaneously.
By default, the toolkits in AIXPRT run one instance at a time and distribute the compute load according to the characteristics of the CPU or GPU under test, as well as any relevant optimizations or accelerators in the toolkit’s reference library. By setting the number of concurrent instances to a number greater than one, a tester can use multiple CPUs or GPUs to run multiple instances of a model at the same time, usually to increase throughput.
With multiple concurrent instances, a tester can leverage additional compute resources to potentially achieve higher throughput without sacrificing latency goals.
In the current version of AIXPRT, testers can run multiple concurrent instances in the OpenVINO, TensorFlow, and TensorRT toolkits. When AIXPRT Community Preview 3 becomes available, this option will extend to the MXNet toolkit. OpenVINO and TensorRT automatically allocate hardware for each instance and don’t let users make manual adjustments. TensorFlow and MXNet require users to manually bind instances to specific hardware. (Manual hardware allocation for multiple instances is more complicated than we can cover today, so we may devote a future blog entry to that topic.)
Setting the number of concurrent instances in AIXPRT
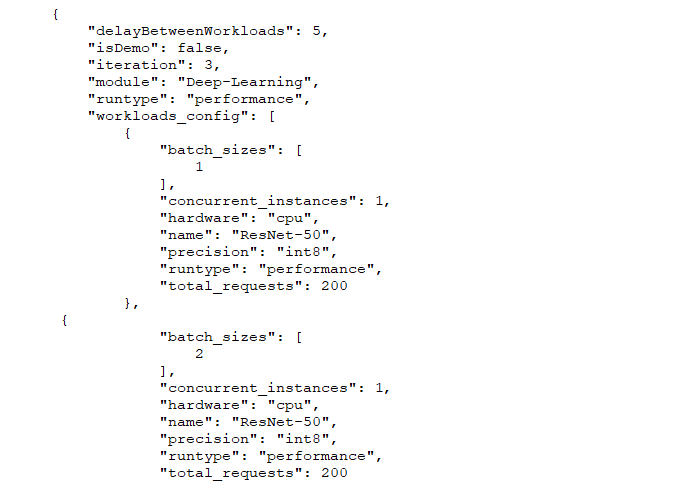
The screenshot below shows part of a sample config file (the same one we used when we discussed batch size and precision). The value in the “concurrent instances” row indicates how many concurrent instances will be operating during the test. In this example, the number is one. To change that value, a tester simply replaces it with the desired number and saves the changes.
If you have any questions or comments (about concurrent instances or anything else), please feel free to contact us.
Justin