BenchmarkXPRT Blog banner

Category: WebXPRT 2015

Which browser is the fastest? It’s complicated.

PCWorld recently published the results of a head-to-head browser performance comparison between Google Chrome, Microsoft Edge, Mozilla Firefox, and Opera. As we’ve noted about similar comparisons, no single browser was the fastest in every test. Browser speed sounds like a straightforward metric, but the reality is complex.

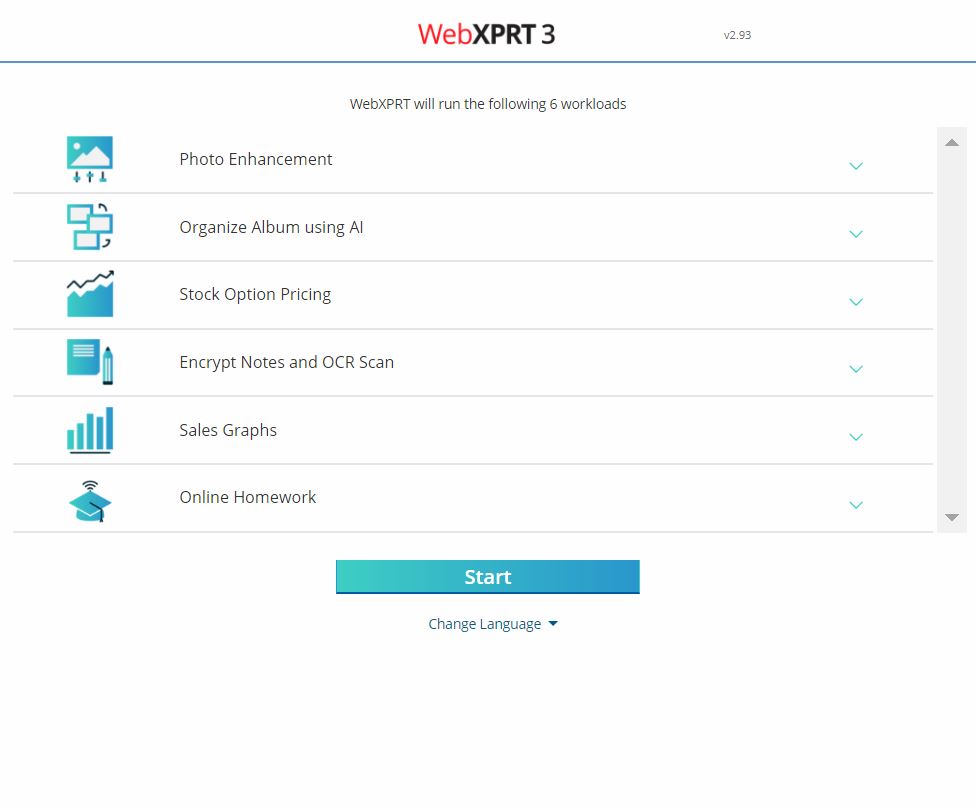
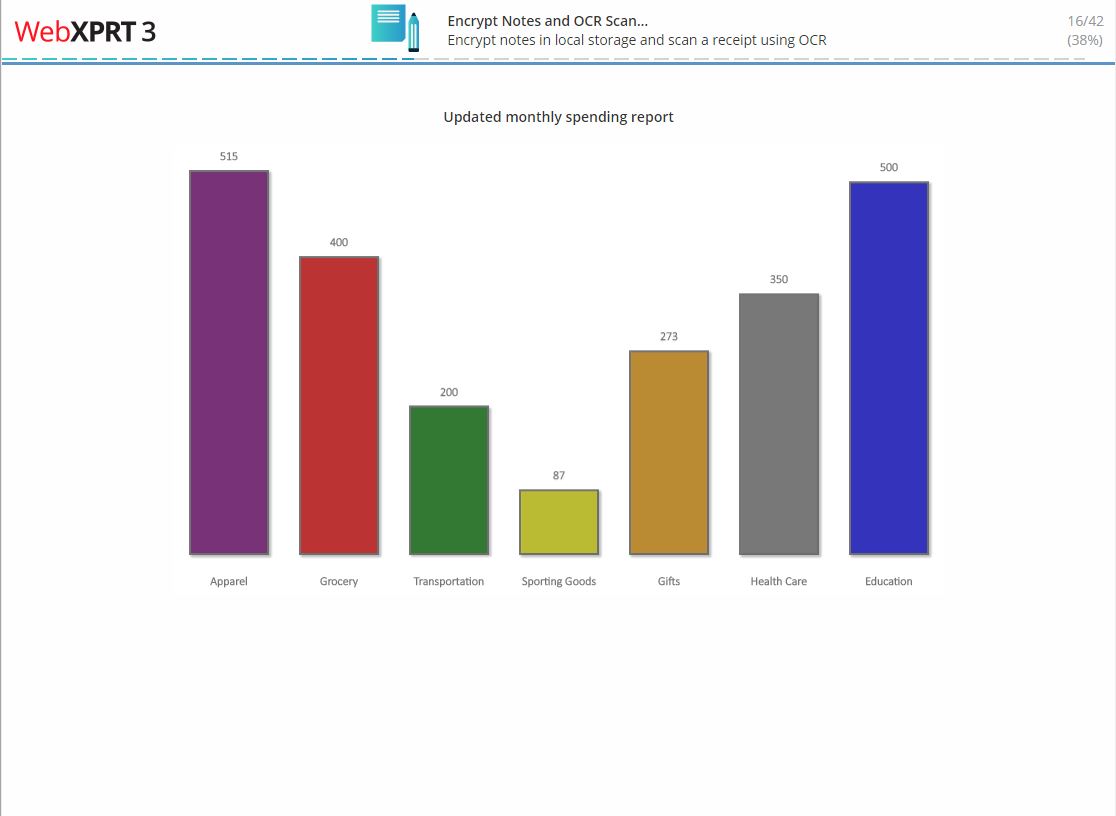
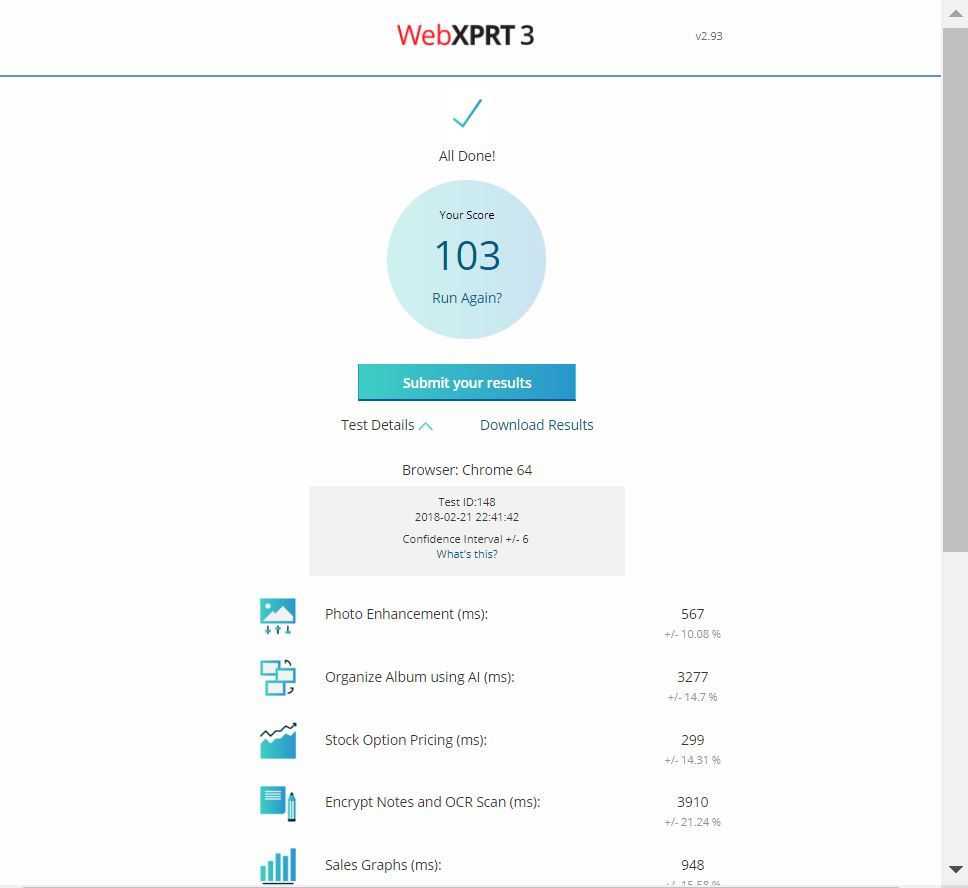
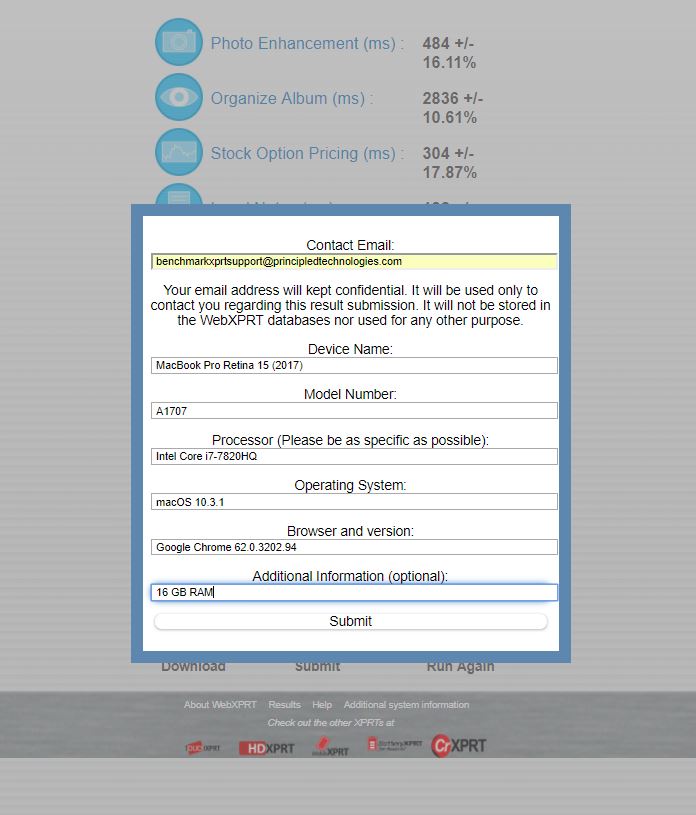
For the comparison, PCWorld used three JavaScript-centric test suites (JetStream, SunSpider, and Octane), one benchmark that simulates user actions (Speedometer), a few in-house tests of their own design, and one benchmark that simulates real-world web applications (WebXPRT). Edge came out on top in JetStream and SunSpider, Opera won in Octane and WebXPRT, and Chrome had the best results in Speedometer and PCWorld’s custom workloads.

The reason that the benchmarks rank the browsers so differently is that each one has a unique emphasis and tests a specific set of workloads and technologies. Some focus on very low-level JavaScript tasks, some test additional technologies such as HTML5, and some are designed to identify strengths or weakness by stressing devices in unusual ways. These approaches are all valid, and it’s important to understand exactly what a given score represents. Some scores reflect a very broad set of metrics, while others assess a very narrow set of tasks. Some scores help you to understand the performance you can expect from a device in your everyday life, and others measure performance in scenarios that you’re unlikely to encounter. For example, when Eric discussed a similar topic in the past, he said the tests in JetStream 1.1 provided information that “can be very useful for engineers and developers, but may not be as meaningful to the typical user.”

As we do with all the XPRTs, we designed WebXPRT to test how devices handle the types of real-world tasks consumers perform every day. While lab techs, manufacturers, and tech journalists can all glean detailed data from WebXPRT, the test’s real-world focus means that the overall score is relevant to the average consumer. Simply put, a device with a higher WebXPRT score is probably going to feel faster to you during daily use than one with a lower score. In today’s crowded tech marketplace, that piece of information provides a great deal of value to many people.

What are your thoughts on browser testing? We’d love to hear from you.

Justin

WebXPRT passes another milestone!

We’re excited to see that users have successfully completed over 250,000 WebXPRT runs! From the original WebXPRT 2013 to the most recent version, WebXPRT 3, this tool has been popular with manufacturers, developers, consumers, and media outlets around the world because it’s easy to run, it runs quickly and on a wide variety of platforms, and it evaluates device performance using real-world tasks.

If you’ve run WebXPRT in any of the more than 458 cities and 64 countries from which we’ve received complete test data—including newcomers Lithuania, Luxembourg, Sweden, and Uruguay—we’re grateful for your help in reaching this milestone. Here’s to another quarter-million runs!

If you haven’t yet transitioned your browser testing to WebXPRT 3, now is a great time to give it a try! WebXPRT 3 includes updated photo workloads with new images and a deep learning task used for image classification. It also uses an optical character recognition task in the Encrypt Notes and OCR scan workload and combines part of the DNA Sequence Analysis scenario with a writing sample/spell check scenario to simulate online homework in the new Online Homework workload. Users carry out tasks like these on their browsers daily, making these workloads very effective for assessing how well a device will perform in the real world.

Happy testing to everyone, and if you have any questions about WebXPRT 3 or the XPRTs in general, feel free to ask!

Justin

The XPRTs in action

In the near future, we’ll update our “XPRTs around the world” infographic, which provides a snapshot of how people are using the XPRTs worldwide. Among other stats, we include the number of XPRT web mentions, articles, and reviews that have appeared during a given period. Recently, we learned how one of those statistics—a single web site mention of WebXPRT—found its way to consumers in more places than we would have imagined.

Late last month, AnandTech published a performance comparison by Andrei Frumusanu examining the Samsung Galaxy S9’s Snapdragon 845 and Exynos 9810 variants and a number of other high-end phones. WebXPRT was one of the benchmarking tools used. The article stated that both versions of the brand-new S9 were slower than the iPhone X and, in some tests, were slower than even the iPhone 7.

A CNET video discussed the article and the role of WebXPRT in the performance comparison, and the article has been reposted to hundreds of tech media sites around the world. A quick survey shows reposts in Albania, Bulgaria, Denmark, Chile, the Czech Republic, France, Germany, Greece, Indonesia, Iran, Italy Japan, Korea, Poland, Russia, Spain, Slovakia, Turkey, and many other countries.

The popularity of the article is not surprising, for it positions the newest flagship phones from the industry’s two largest phone makers in a head-to-head comparison with a somewhat unexpected outcome. AnandTech did nothing to stir controversy or sensationalize the test results, but simply provided readers with an objective, balanced assessment of how these devices compare so that they could draw their own conclusions. The XPRTs share this approach.

We’re grateful to Andrei and others at AnandTech who’ve used the XPRTs over the years to produce content that helps consumers make informed decisions. WebXPRT is just part of AnandTech’s toolkit, but it’s one that’s accessible to anybody free of charge. With the help of BenchmarkXPRT Development Community members, we’ll continue to publish XPRT tools that help users everywhere gain valuable insight into device performance.

Justin

WebXPRT 3 arrives next week!

After much development work and testing, we’re happy to report that we’ll be releasing WebXPRT 3 early next week!

Here are the final workload names and descriptions.

1) Photo Enhancement: Applies three effects to two photos each using Canvas.
2) Organize Album Using AI: Detects faces and classifies images using the ConvNetJS neural network library.
3) Stock Option Pricing: Calculates and displays graphics views of a stock portfolio using Canvas, SVG, and dygraphs.js.
4) Encrypt Notes and OCR Scan: Encrypts notes in local storage and scans a receipt using optical character recognition.
5) Sales Graphs: Calculates and displays multiple views of sales data using InfoVis and d3.js.
6) Online Homework: Performs science and English homework using Web Workers and Typo.js spell check.

As we mentioned in an earlier blog post, the updated photo workloads contain new images and a deep learning task. We also added an optical character recognition task to the Local Notes workload and combined part of the DNA Sequence Analysis scenario with a writing sample/spell check scenario to simulate online homework in the new Online Homework workload.

Longtime WebXPRT users will immediately notice a completely new UI. We worked to improve the UI’s appearance on smaller devices such as phones and we think testers will find it easier to navigate.

Testers can still choose to run individual workloads and we’re once again offering English, German, and Simplified Chinese language options.

Below my sig, I’ve included pictures of WebXPRT 3’s start test and results pages, as well as an in-test screen capture.

We’re thankful for all the interest in WebXPRT 3 so far and believe the new version of WebXPRT will be as relevant and reliable as WebXPRT 2013 and 2015—and easier to use. We look forward to seeing new results submissions next week!

Justin

WebXPRT 3 start page

WebXPRT 3 in test

Results page

How to submit results for the WebXPRT Processor Comparison Chart

The WebXPRT 2015 Processor Comparison Chart is in its second month, and we’re excited to see that people are browsing the scores. We’re also starting to receive more WebXPRT score submissions for publication, so we thought it would be a good time to describe how that process works.

Unlike sites that publish any results they receive, we hand-select results from internal lab testing, end-of-test user submissions, and reliable tech media sources. In each case, we evaluate whether the score is consistent with general expectations. For sources outside of our lab, that evaluation includes checking to see whether there is enough detailed system information to get a sense of whether the score makes sense. We do this for every score on the WebXPRT results page and the general XPRT results page.

If we decide to publish a WebXPRT result, that score automatically appears in the processor comparison chart as well. If you would like to submit your score, the submission process is quick and easy. At the end of the WebXPRT test run, click the Submit button below the individual workload scores, complete the short submission form, and click Submit again. The screenshot below shows how the form would look if I submitted a score at the end of a WebXPRT run on my personal system.

WebXPRT results submission

After you submit your score, we’ll contact you to confirm the name we should display as the source for the data. You can use one of the following:

  • Your first and last name
  • “Independent tester,” if you wish to remain anonymous
  • Your company’s name, provided that you have permission to submit the result in their name. If you want to use a company name, we ask that you provide your work email address.


We will not publish any additional information about you or your company without your permission.

We look forward to seeing your score submissions, and if you have suggestions for the processor chart or any other aspect of the XPRTs, let us know!

Justin

Introducing the WebXPRT 2015 Processor Comparison Chart

Today, we’re excited to announce the WebXPRT 2015 Processor Comparison Chart, a new tool that makes it easier to access hundreds of PT-curated, real-world performance scores from a wide range of devices covering everything from TVs to phones to tablets to PCs.

The chart offers a quick way to browse and compare WebXPRT 2015 results grouped by processor. Unlike benchmark-score charts that may contain results from unknown sources, PT hand-selected each of the results from internal lab testing and reliable tech media sources. If we published multiple scores for an individual processor, the score presented in the chart will be an average of those scores. Users can hover over and click individual score bars for additional information about the test results and test sources for each processor.

WebXPRT proc chart capture

We think the WebXPRT Processor Comparison Chart will be a valuable resource for folks interested in performance testing and product evaluation, but the current iteration is only the beginning. We plan to add additional capabilities on a regular basis, such a detailed filtering and enhanced viewing and navigational options. It’s also possible that we may integrate other XPRT benchmarks down the road.

Most importantly, we want the chart to be a great asset for its users, and that’s where you come in. We’d love to hear your feedback on the features and types of data you’d like to see. If you have suggestions, please let us know!

Justin

Check out the other XPRTs:

Forgot your password?