In November, we published our WebXPRT 3 browser performance comparison, so we decided it was time to see if the performance rankings of popular browsers have changed in the last nine months.
For this round of tests, we used the same laptop as last time: a Dell XPS 13 7930 with an Intel Core i3-10110U processor and 4 GB of RAM running Windows 10 Home, updated to version 1909 (18363.1556). We installed all current Windows updates and tested on a clean system image. After the update process completed, we turned off updates to prevent them from interfering with test runs. We ran WebXPRT 3 three times each on five browsers: Brave, Google Chrome, Microsoft Edge, Mozilla Firefox, and Opera. For each browser, the score we post below is the median of the three test runs.
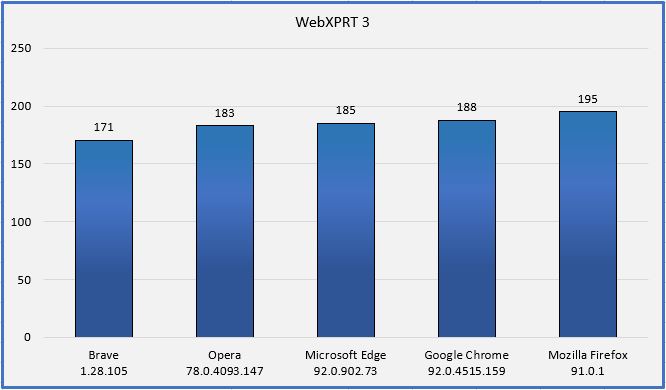
In our last round of tests, the four Chromium-based browsers (Brave, Chrome, Edge, and Opera) produced very close scores, though we saw about a four percent lower score from Brave. In this round of testing, performance improved for all four of the Chromium-based browsers. Chrome, Edge, and Opera still produced very close scores, but Brave’s performance still lagged, this time by about seven percent.
Firefox separated itself from the pack with a much higher score and has been the clear winner in all three rounds of testing. During our second round of testing in November, every browser except for Chrome saw slightly slower performance than the first round. In these latest tests, all the Chromium-based browsers produced significantly higher scores than the second round. When discussing browser performance, it’s important to remember that there are many possible reasons for these performance changes—including changes in browser overhead or changes in Windows—and most users may not notice the changes during everyday tasks.
Do these results mean that Mozilla Firefox will always provide you with a speedier web experience? As we noted in previous comparisons, a device with a higher WebXPRT score will probably feel faster during daily use than one with a lower score. For comparisons on the same system, however, the answer depends on several factors, such as the types of things you do on the web, how the extensions you’ve installed affect performance, how frequently the browsers issue updates and incorporate new web technologies, and how accurately each browser’s default installation settings reflect how you would set up that browser for your daily workflow.
In addition, browser speed can increase or decrease significantly after an update, only to swing back in the other direction shortly thereafter. OS-specific optimizations can also affect performance, such as with Edge on Windows 10 or Chrome on Chrome OS. All these variables are important to keep in mind when considering how browser performance comparison results translate to your everyday experience. Do you have insights you’d like to share from using WebXPRT to compare browser performance? Let us know!
Justin