
Microsoft recently released a new Chromium-based version of the Edge browser, and several tech press outlets have released reviews and results from head-to-head browser performance comparison tests. Because WebXPRT is a go-to benchmark for evaluating browser performance, PCMag, PCWorld, and VentureBeat, among others, used WebXPRT 3 scores as part of the evaluation criteria for their reviews.
We thought we would try a quick experiment of our own, so we grabbed a recent laptop from our Spotlight testbed: a Dell XPS 13 7930 running Windows 10 Home 1909 (18363.628) with an Intel Core i3-10110U processor and 4 GB of RAM. We tested on a clean system image after installing all current Windows updates, and after the update process completed, we turned off updates to prevent them from interfering with test runs. We ran WebXPRT 3 three times on six browsers: a new browser called Brave, Google Chrome, the legacy version of Microsoft Edge, the new version of Microsoft Edge, Mozilla Firefox, and Opera. The posted score for each browser is the median of the three test runs.
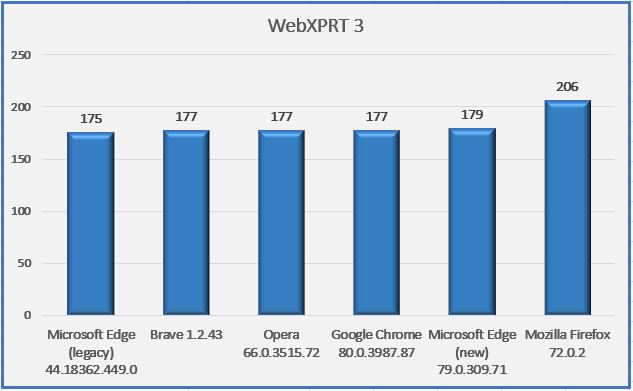
As you can see in the chart below, five of the browsers (legacy Edge, Brave, Opera, Chrome, and new Edge) produced scores that were nearly identical. Mozilla Firefox was the only browser that produced a significantly different score. The parity among Brave, Chrome, Opera, and the new Edge is not that surprising, considering they are all Chromium-based browsers. The rank order and relative scaling of these results is similar to the results published by the tech outlets mentioned above.
Do these results mean that Mozilla Firefox will provide you with a speedier web experience? Generally, a device with a higher WebXPRT score is probably going to feel faster to you during daily use than one with a lower score. For comparisons on the same system, however, the answer depends in part on the types of things you do on the web, how the extensions you’ve installed affect performance, how frequently the browsers issue updates and incorporate new web technologies, and how accurately the browsers’ default installation settings reflect how you would set up the same browsers for your daily workflow.
In addition, browser speed can increase or decrease significantly after an update, only to swing back in the other direction shortly thereafter. OS-specific optimizations can also affect performance, such as with Edge on Windows 10 and Chrome on Chrome OS. All of these variables are important to keep in mind when considering how browser performance comparison results translate to your everyday experience. In such a competitive market, and with so many variables to consider, we’re happy that WebXPRT can help consumers by providing reliable, objective results.
What are your thoughts on today’s competitive browser market? We’d love to hear from you.
Justin


