BenchmarkXPRT Blog banner

Month: October 2017

Looking for performance clues

We’ve written before about how the operating system and other software can influence test scores and even battery life. Benchmarks like the XPRTs provide overall results, but teasing out which factors affect those results may require some detective work. The key is to collect individual data points as evidence to what may be causing performance changes.

The Apple iOS 11 rollout last month is an excellent example of the effect of software on device performance. Angry tweets started almost immediately after the update, claiming that iOS 11 drained device batteries. iPhone users here at PT experienced similar issues. What was the cause of that performance drop? The hardware remained the same. So, did software cause the problem?

Less than a week after the rollout, Mashable published an explanation of possible causes. The article quotes research from mobile security firm Wandera showing that, for the 50,000 “moderate to heavy iPhone and iPad users” in the study, devices running iOS 11 burned through their battery at much faster rates than the same devices running iOS 10. They cite two possible causes:

    • devices often re-categorize the files stored on them for every new OS install, which may account for some of the battery issues.
    • many apps are not optimized for iOS 11 yet.


While these explanations make sense, with a little more digging, we could get closer to actually solving the mystery instead of guessing at the causes. After all, it is also possible that people are using iOS 11 differently from iOS 10. So, how could a dedicated sleuth investigate further? Anyone using benchmarks and hands-on testing to sift through various scenarios and configurations could get us closer to solving this mystery and any other software-based performance anomalies. But it’s a daunting task—changing only one variable at a time and recording the results is like pounding the streets and knocking on doors to solve a case.

In all likelihood, some combination of Apple iOS updates and application changes will improve the battery life for iOS 11. In the meantime, we wish we had an XPRT that could test battery life on iOS. Who knows, maybe some future version of WebXPRT will be able to help in future sleuthing.

Eric

Machine learning performance tool update

Earlier this year we started talking about our efforts to develop a tool to help in evaluating machine learning performance. We’ve given some updates since then, but we’ve also gotten some questions, so I thought I’d do my best to summarize our answers for everyone.

Some have asked what kinds of algorithms we’ve been looking into. As we said in an earlier blog, we’re looking at  algorithms involved in computer vision, natural language processing, and data analytics, particularly different aspects of computer vision.

One seemingly trivial question we’ve received regards the proposed name, MLXPRT. We have been thinking of this tool as evaluating machine learning performance, but folks have raised a valid concern that it may well be broader than that. Does machine learning include deep learning? What about other artificial intelligence approaches? I’ve certainly seen other approaches lumped into machine learning, probably because machine learning is the hot topic of the moment. It feels like everything is boasting, “Now with machine learning!”

While there is some value in being part of such a hot movement, we’ve begun to wonder if a more inclusive name, such as AIXPRT, would be better. We’d love to hear your thoughts on that.

We’ve also had questions about the kind of devices the tool will run on. The short answer is that we’re concentrating on edge devices. While there is a need for server AI/ML tools, we’ve been focusing on the evaluating the devices close to the end users. As a result, we’re looking at the inference aspect of machine learning rather than the training aspect.

Probably the most frequent thing we’ve been asked about is the timetable. While we’d hoped to have something available this year, we were overly optimistic. We’re currently working on a more detailed proposal of what the tool will be, and we aim to make that available by the end of this year. If we achieve that goal, our next one will be to have a preliminary version of the tool itself ready in the first half of 2018.

As always, we seek input from folks, like yourself, who are working in these areas. What would you most like to see in an AI/machine learning performance tool? Do you have any questions?

Bill 

What’s next for HDXPRT?

A few months ago, we discussed some initial ideas for the next version of HDXPRT, including updating the benchmark’s workloads and real-world trial applications and improving the look and feel of the UI. This week, we’d like to share more about the status of the HDXPRT development process.

We’re planning to keep HDXPRT’s three test categories: editing photos, editing music, and converting videos. We’re also planning to use the latest trial versions of the same five applications included in HDXPRT 2014: Adobe Photoshop Elements, Apple iTunes, Audacity, CyberLink MediaEspresso, and HandBrake. The new versions of each of these programs include features and capabilities that may enhance the HDXPRT workloads. For example, Adobe Photoshop Elements 2018 includes interesting new AI tools such as “Open Closed Eyes,” which purports to fix photos ruined by subjects who blinked at the wrong time. We’re evaluating whether any of the new technologies on offer will be a good fit for HDXPRT.

We’re also evaluating how the new Windows 10 SDK and Fall Creators Update will affect HDXPRT. It’s too early to discuss potential changes in any detail, but we know we’ll need to adapt to new development tools, and it’s possible that the Fluent Design System will affect the HDXPRT UI beyond the improvements we already had in mind.

As HDXPRT development progresses, we’ll continue to keep the community up to date. If you have suggestions or insights into the new Fall Creators Update or any of HDXPRT’s real-world applications, we’d love to hear from you! If you’re just reading out about HDXPRT for the first time, you can find out more about the purpose, structure, and capabilities of the test here.

Justin

Introducing the WebXPRT 2015 Processor Comparison Chart

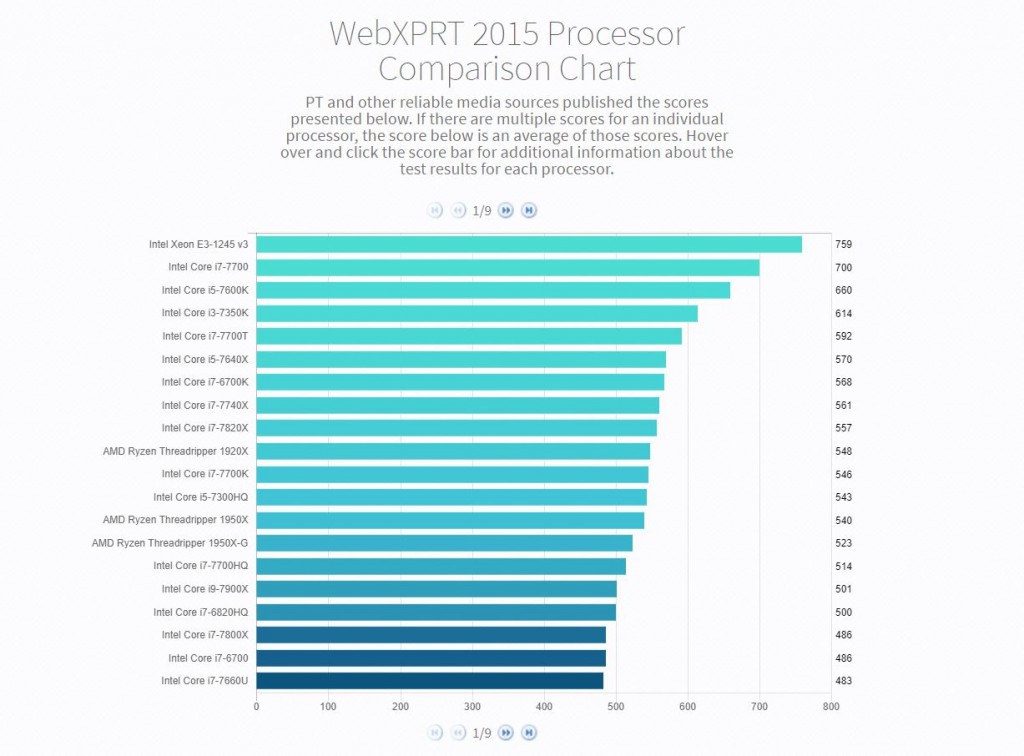
Today, we’re excited to announce the WebXPRT 2015 Processor Comparison Chart, a new tool that makes it easier to access hundreds of PT-curated, real-world performance scores from a wide range of devices covering everything from TVs to phones to tablets to PCs.

The chart offers a quick way to browse and compare WebXPRT 2015 results grouped by processor. Unlike benchmark-score charts that may contain results from unknown sources, PT hand-selected each of the results from internal lab testing and reliable tech media sources. If we published multiple scores for an individual processor, the score presented in the chart will be an average of those scores. Users can hover over and click individual score bars for additional information about the test results and test sources for each processor.

WebXPRT proc chart capture

We think the WebXPRT Processor Comparison Chart will be a valuable resource for folks interested in performance testing and product evaluation, but the current iteration is only the beginning. We plan to add additional capabilities on a regular basis, such a detailed filtering and enhanced viewing and navigational options. It’s also possible that we may integrate other XPRT benchmarks down the road.

Most importantly, we want the chart to be a great asset for its users, and that’s where you come in. We’d love to hear your feedback on the features and types of data you’d like to see. If you have suggestions, please let us know!

Justin

Check out the other XPRTs:

Forgot your password?