
I just spent the last couple of days at IDF16 Shenzhen. It was a great opportunity to talk to folks about the XPRTs, see some future technology demos, and think about the future of the XPRTs.
The technology and product demos included lots of interesting technology. I saw everything from the latest computers to games to VR to body monitoring.
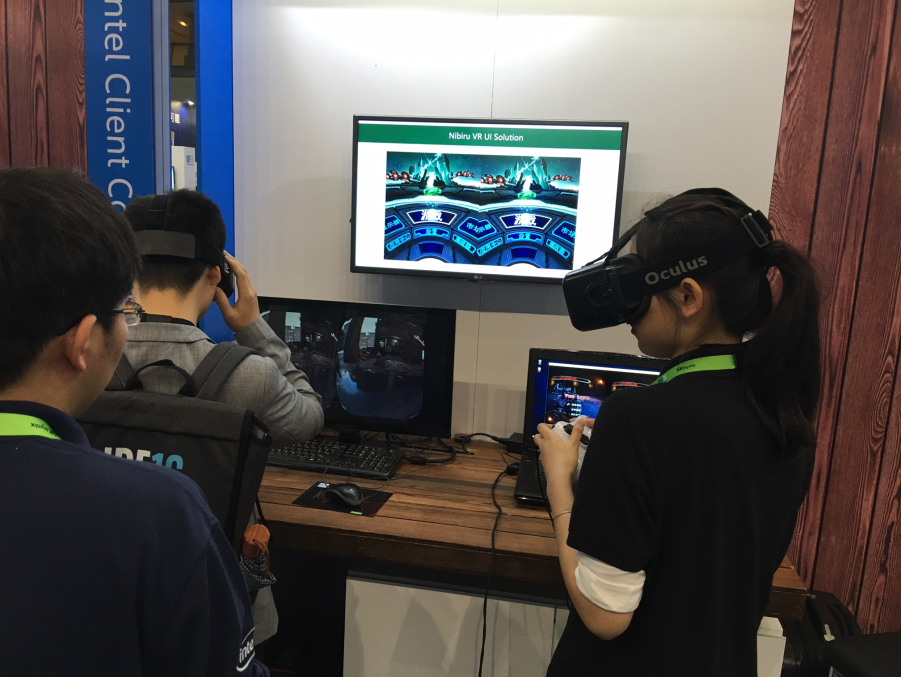
Of particular interest to me were the future-looking technologies beyond the usual array of notebooks, tablets, and servers. I was able to see drones that could video a person by following them, while avoiding obstacles such as trees. I saw a number of demos using the Oculus Rift. I got to see some robot demos that were impressive in their use of the fairly off-the-shelf technology driving them. I would have had myself scanned and then had a small 3D model of myself printed, but I was pressed for time and the line was too long.
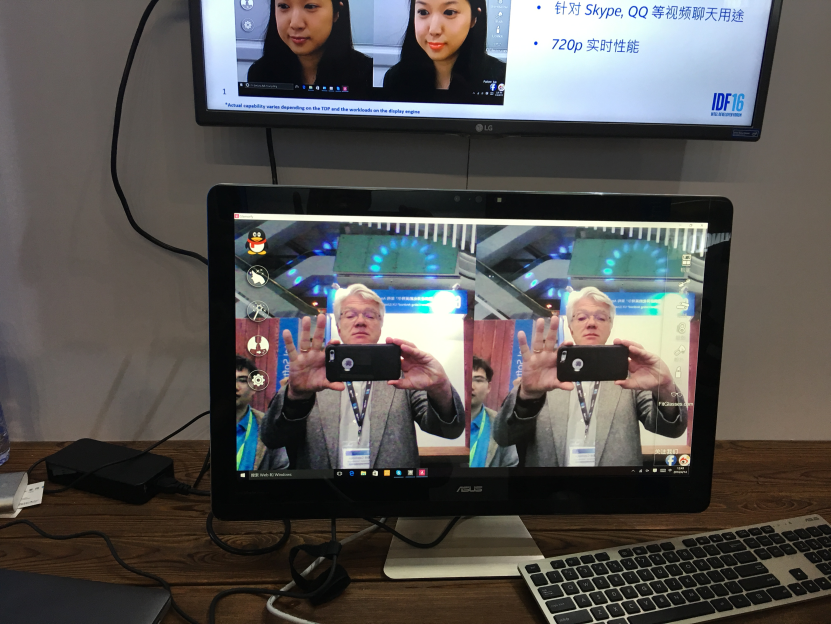
I was particularly interested in a mirror that could scan a person and tell things about their health. I also found somewhat amusing a technology demo that was able to “beautify” a person in real time for use with teleconferencing such as Skype. While I might quibble about the definition of beautify, the idea of real-time video enhancement is intriguing. (Given the raw material I gave it to work with, it was no easy task to accomplish!) Maybe I won’t need to shave before my next WebEx meeting…
All of these technologies give some hints as to areas the XPRTs may go in the future. While I don’t think we are quite ready for BeautificationXPRT, there may well be some workloads we should consider such as path finding, real-time video enhancement, health monitoring, virtual reality, and gaming. Please let us know your thoughts about what near-term technologies we should be considering in future workloads.
We definitely have exciting times still ahead of us in technology and the XPRTs!
Bill


