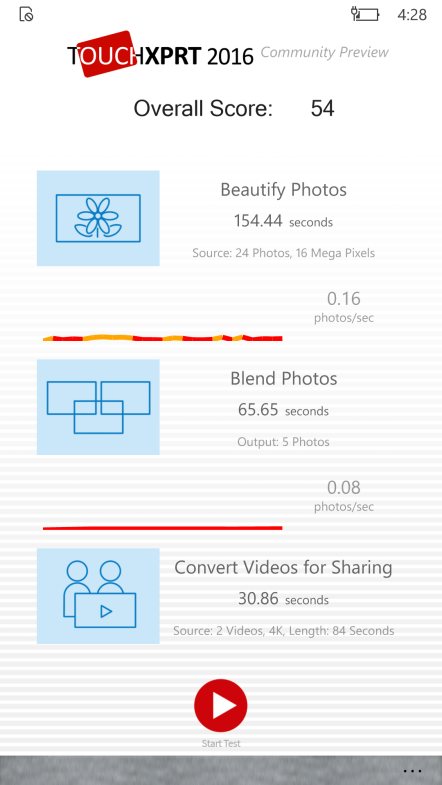
As Justin explained last week, we’ve resolved the issue we found with the TouchXPRT CP. I’m happy to say that the testing went well and that we released CP3 this week.
It’s been only three weeks since we announced the XPRT Weekly Tech Spotlight, and we already have another big announcement! Principled Technologies has joined with ChickTech Seattle to host the first ever XPRT Women Code-a-Thon! In this two-day event, participants will compete to create the best new candidate workload for WebXPRT or MobileXPRT. The workloads can’t duplicate existing workloads, so we are looking forward to seeing the new ideas.
Judges will study all the workloads and award prizes to the top three: $2,500 for first place, $1,500 for second place, and $1,000 for third place. Anyone interested can register here.
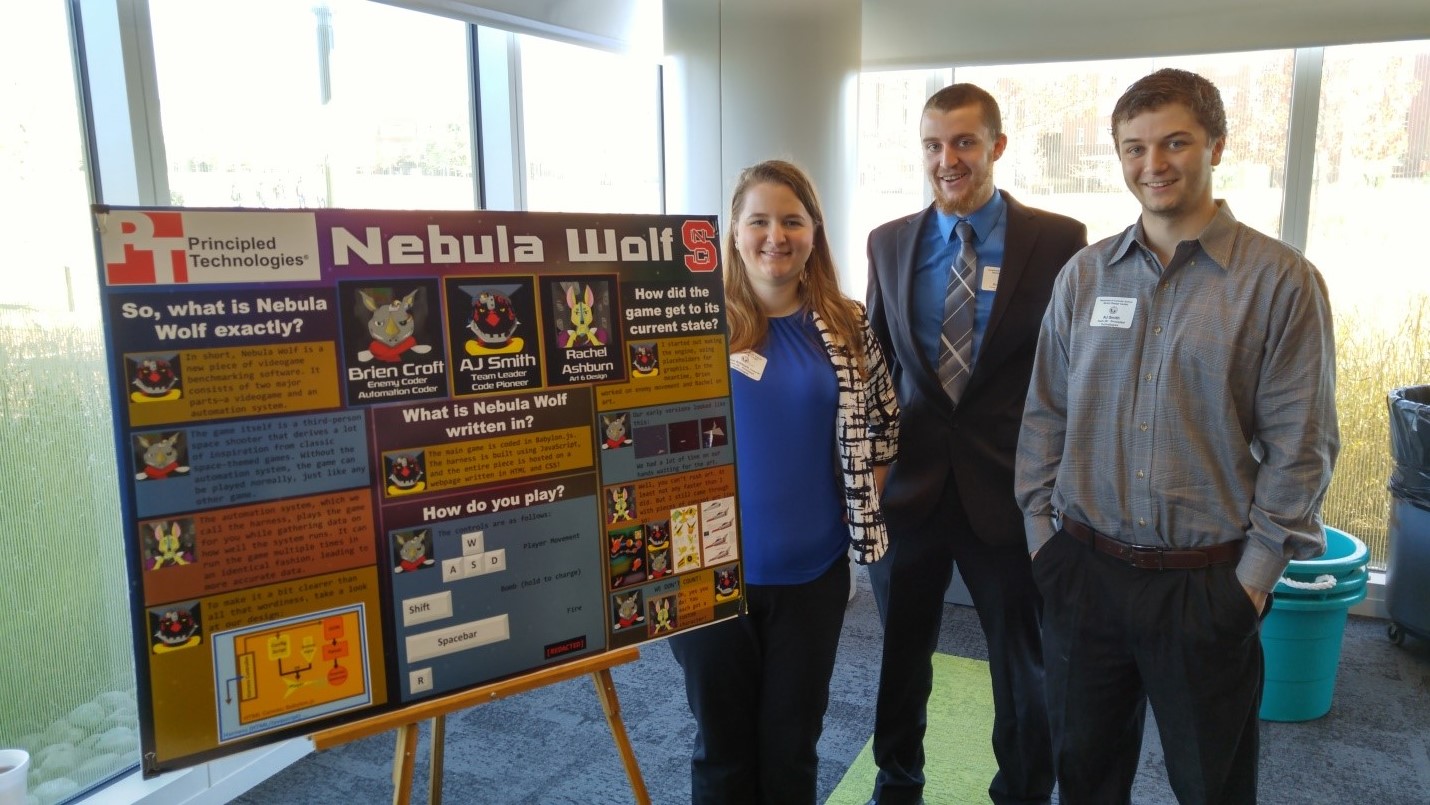
PT and the BenchmarkXPRT Development Community are committed to promoting the advancement of women in STEM, but we also win by doing good. As with the NCSU senior project, the BenchmarkXPRT Development Community will get some fresh perspectives and some new experimental test tools. Everyone wins!
So much has happened in 2016 and January isn’t even over yet. The year is off to a great start!
Eric