BenchmarkXPRT Blog banner

Month: July 2023

Exploring the XPRT white paper library

As part of our commitment to publishing reliable, unbiased benchmarks, we strive to make the XPRT development process as transparent as possible. In the technology assessment industry, it’s not unusual for people to claim that any given benchmark contains hidden biases, so we take preemptive steps to address this issue by publishing XPRT benchmark source code, detailed system disclosures and test methodologies, and in-depth white papers. Today, we’re focusing on the XPRT white paper library.

The XPRT white paper library currently contains 21 white papers that we’ve published over the last 12 years. We started publishing white papers to provide XPRT users with more information about how we design our benchmarks, why we make certain development decisions, and how the benchmarks work. If you have questions about any aspect of one of the XPRT benchmarks, the white paper library is a great place to find some answers.

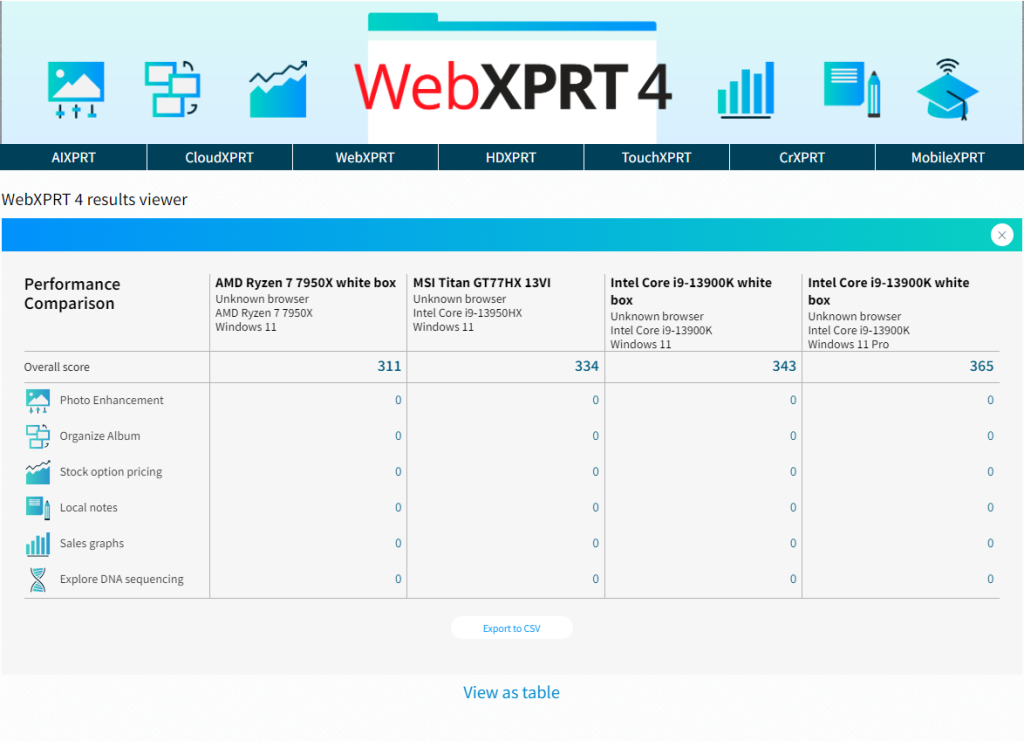
For example, the Exploring WebXPRT 4 white paper describes the design and structure of WebXPRT 4, including detailed information about the benchmark’s harness, HTML5 and WebAssembly (WASM) capability checks, and the structure of the performance test workloads. It also includes explanations of the benchmark’s scoring methodology, how to automate tests, and how to submit results for publication.

The companion WebXPRT 4 results calculation white paper explains the formulas that WebXPRT 4 uses to calculate the individual workload scenario scores and overall score, provides an overview of the statistical techniques WebXPRT uses to translate raw timings into scores, and explains the benchmark’s confidence interval and how it differs from typical benchmark variability. To supplement the white paper’s discussion of the results calculation process, we published a results calculation spreadsheet that shows the raw data from a sample test run and reproduces the exact calculations WebXPRT uses to produce test scores.

We hope that the XPRT white paper library will prove to be a useful resource for you. If you have questions about any of our white papers, or suggestions for topics that you’d like us to cover in possible future white papers, please let us know!

Justin

Check out the WebXPRT 4 results viewer

New visitors to our site may not be aware of the WebXPRT 4 results viewer and how to use it. The viewer provides WebXPRT 4 users with an interactive, information-packed way to browse test results that is not available for earlier versions of the benchmark. With the viewer, users can explore all of the PT-curated results that we’ve published on WebXPRT.com, find more detailed information about those results, and compare results from different devices. The viewer currently displays over 460 results, and we add new entries each week.

The screenshot below shows the tool’s default display. Each vertical bar in the graph represents the overall score of a single test result, with bars arranged from lowest to highest. To view a single result in detail, the user hovers over a bar until it turns white and a small popup window displays the basic details of the result. If the user clicks to select the highlighted bar, the bar turns dark blue, and the dark blue banner at the bottom of the viewer displays additional details about that result.

In the example above, the banner shows the overall score (227), the score’s percentile rank (66th) among the scores in the current display, the name of the test device, and basic hardware disclosure information. If the source of the result is PT, users can click the Run info button to see the run’s individual workload scores. If the source is an external publisher, users can click the Source link to navigate to the original site.

The viewer includes a drop-down menu that lets users quickly filter results by major device type categories, and a tab that with additional filtering options, such as browser type, processor vendor, and result source. The screenshot below shows the viewer after I used the device type drop-down filter to select only desktops.

The screenshot below shows the viewer as I use the filter tab to explore additional filter options, such processor vendor.

The viewer also lets users pin multiple specific runs, which is helpful for making side-by-side comparisons. The screenshot below shows the viewer after I pinned four runs and viewed them on the Pinned runs screen.

The screenshot below shows the viewer after I clicked the Compare runs button. The overall and individual workload scores of the pinned runs appear in a table.

We’re excited about the WebXPRT 4 results viewer, and we want to hear your feedback. Are there features you’d really like to see, or ways we can improve the viewer? Please let us know, and send us your latest test results!

Justin

Check out the other XPRTs:

Forgot your password?