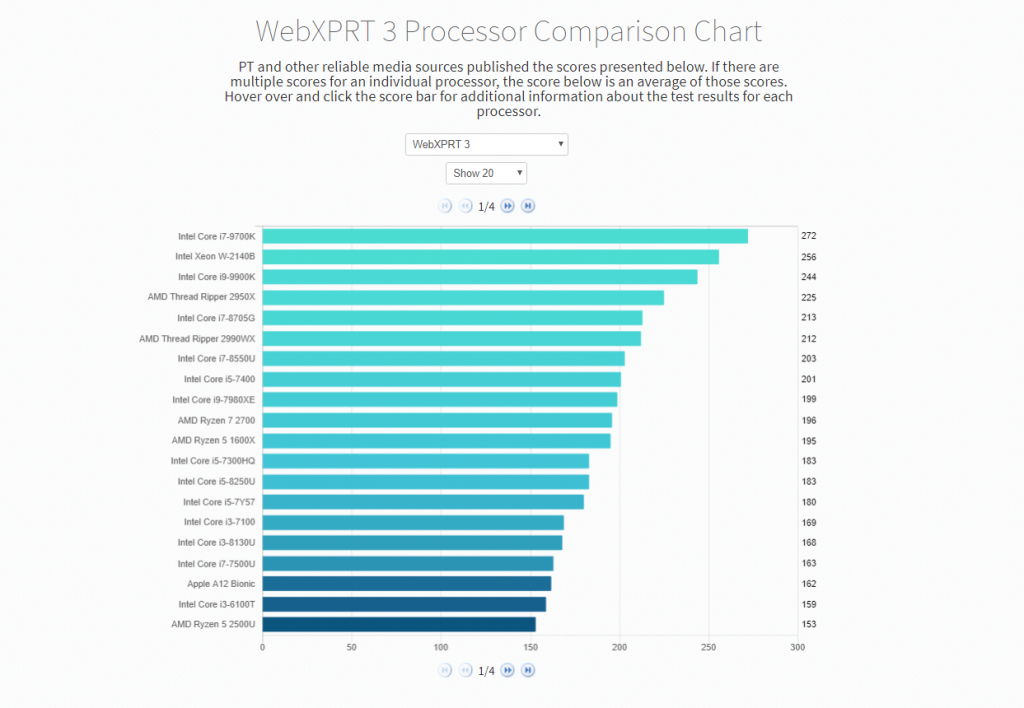
Last fall, we published the WebXPRT 2015 Processor Comparison Chart, a tool that makes it easier to access hundreds of PT-curated, real-world performance scores from a wide range of devices including everything from TVs to phones to tablets to PCs. Today, we’re happy to announce that we’ve added a WebXPRT 3 Processor Comparison Chart.
The WebXPRT 3 chart follows the same format as the WebXPRT 2015 chart, letting you click the average score of each processor to view all the WebXPRT 3 results we currently have for that processor. You can change the number of results the chart displays on each page, and as the screenshot below shows, a new drop-down menu lets you toggle back and forth between the WebXPRT 3 and WebXPRT 2015 charts. W plan to add additional capabilities on a regular basis, so if you have ideas for features and types of data you’d like to see, let us know!
If you’d like to submit results for us to consider for publication in the chart, follow the detailed instructions here. The submission process is quick and easy. We look forward to seeing your results!
Justin