
Cloud-based NoSQL databases are the operational heart of many businesses that rely on near-instantaneous data processing to provide services such as real-time web applications, financial transactions, and live analytics. In the big data space, the levels of compute performance needed to ensure consistently higher throughput and lower latency often come at a higher price, but our tests proved that some NoSQL database solutions can provide much lower latency rates than others—at a lower cost—even as workloads scale.
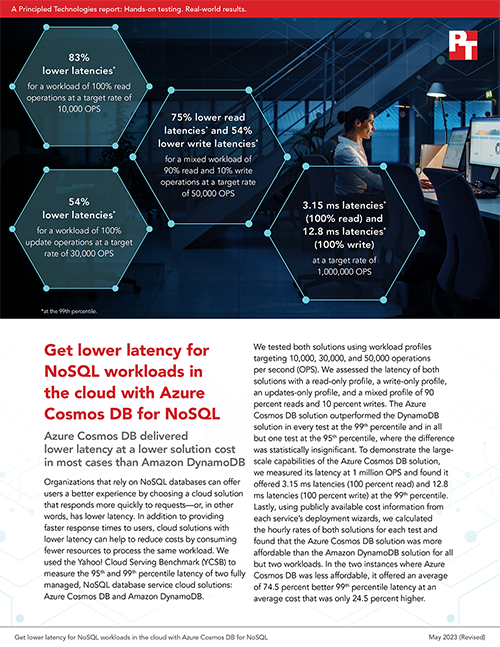
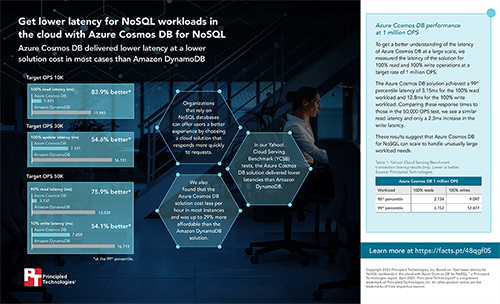
We used the Yahoo! Cloud Serving Benchmark to measure the latency of two fully managed, NoSQL database service cloud solutions: Microsoft Azure Cosmos DB and Amazon DynamoDB. We tested both solutions using workload profiles targeting 10,000, 30,000, and 50,000 operations per second (OPS). We found that the Azure Cosmos DB solution outperformed the Amazon DynamoDB solution in all but one instance, where the difference was statistically insignificant. Plus, using each service’s public cost information, we found that the Azure Cosmos DB solution was more affordable than the Amazon DynamoDB solution in most of the instances we tested. In the two instances where the Amazon DynamoDB solution was cheaper, the Azure Cosmos DB solution provided better latency while processing those workloads.
We also tested the large-scale capabilities of the Azure Cosmos DB solution by measuring latency at a target rate of 1 million OPS. At that high rate, the Azure Cosmos DB solution offered 3.15 ms latency for a 100 percent read workload and 12.8 ms latency for a 100 percent write workload at the 99th percentile, which suggests that the solution can deliver low response times with extremely large workloads.
Our findings show that Azure Cosmos DB can deliver lower latency at a lower solution cost than Amazon DynamoDB across a variety of workload profiles. Higher performance and lower costs are compelling reasons why Azure Cosmos DB is a great cloud-based NoSQL database solution for many big-data-oriented companies.
To dig into the details of our comparison tests and conclusions, check out the report and infographic below.

Principled Technologies is more than a name: Those two words power all we do. Our principles are our north star, determining the way we work with you, treat our staff, and run our business. And in every area, technologies drive our business, inspire us to innovate, and remind us that new approaches are always possible.


