A Principled Technologies report: Hands-on testing. Real-world results.
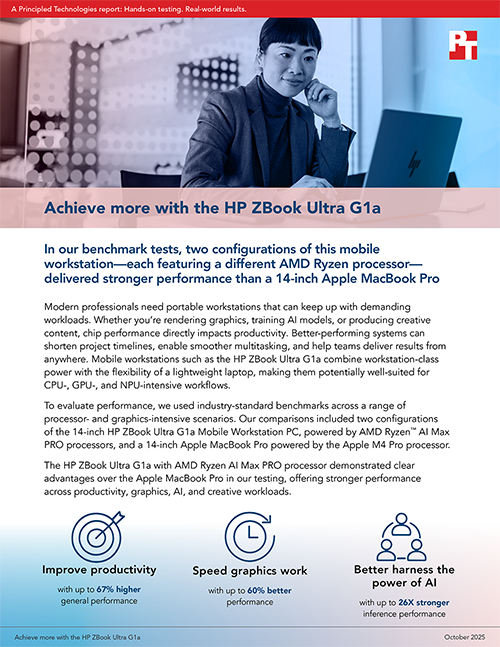
Achieve more with the HP ZBook Ultra G1a
In our benchmark tests, two configurations of this mobile workstation—each featuring a different AMD Ryzen processor—delivered stronger performance than a 14-inch Apple MacBook Pro
Modern professionals need portable workstations that can keep up with demanding workloads. Whether you’re rendering graphics, training AI models, or producing creative content, chip performance directly impacts productivity. Better-performing systems can shorten project timelines, enable smoother multitasking, and help teams deliver results from anywhere. Mobile workstations such as the HP ZBook Ultra G1a combine workstation-class power with the flexibility of a lightweight laptop, making them potentially well-suited for CPU-, GPU-, and NPU-intensive workflows.
To evaluate performance, we used industry-standard benchmarks across a range of processor- and graphics-intensive scenarios. Our comparisons included two configurations of the 14-inch HP ZBook Ultra G1a Mobile Workstation PC, powered by AMD Ryzen™ AI Max PRO processors, and a 14-inch Apple MacBook Pro powered by the Apple M4 Pro processor.
The HP ZBook Ultra G1a with AMD Ryzen AI Max PRO processor demonstrated clear advantages over the Apple MacBook Pro in our testing, offering stronger performance across productivity, graphics, AI, and creative workloads.
What and how we tested
HP ZBook Ultra G1a (two configurations):
AMD Ryzen AI Max+ PRO 395 processor with AMD Radeon™ 8060S graphics
16 cores with 32 threads
AMD XDNA™ 2 neural processing unit (NPU) architecture supporting “up to 50”1 tera operations per second (TOPS)
AMD iGPU RDNA™ 3.5 architecture with “40 raytracing acceleration cores”2
128 GB of memory
2 TB of PCIe® NVMe® SSD storage
74.5WHr battery
AMD Ryzen AI Max PRO 390 processor with AMD Radeon 8050S graphics
12 cores with 24 threads
64 GB of memory
1 TB of PCIe NVMe SSD storage
74.5WHr battery
14-inch Apple MacBook Pro
Apple M4 Pro processor with 16-core GPU
12 cores
24 GB of memory
512 GB of PCIe NVMe SSD storage
72.4WHr battery
16-core Neural Engine
To assess general productivity, graphics, on-device AI, and creative workload performance, we ran these benchmarks:
PassMark PerformanceTest 11.1
Cinebench R23
3DMark
Procyon AI Computer Vision
Geekbench AI GPU
Chaos V-Ray CPU
HP provided the systems. The results we report reflect the specific configurations we tested. Any difference in the configurations you test, as well as screen brightness, network traffic, or software additions, can affect these results. For a deeper dive into our testing parameters and procedures, see the science behind the report.
About the HP ZBook Ultra G1a Mobile Workstation PC
Each version of the ISV-certified 14-inch HP ZBook Ultra G1a Next Gen AI Mobile Workstation PC includes an AMD Ryzen AI PRO CPU, integrated AMD Radeon Graphics, up to 128 GB of Low-Power Double Data Rate 5X (LPDDR5X) memory, and up to 4 TB of PCIe Gen4 x4 NVMe SSD storage.3 Additional benefits of HP ZBook mobile workstations include:4,5
Portable design: At just 3.46 lbs., the “thinnest ZBook ever”6 makes it easy to take demanding workflows from the office to the field.
AI-focused performance: As a Windows Copilot+ PC, the ZBook Ultra G1a features a built-in NPU capable of delivering up to “50 trillion operations per second (TOPS).”7 This enables users to offload and run productivity tasks locally on the NPU while simultaneously tackling AI-enhanced professional workflows.
Flexible memory for graphics-heavy workloads: Assign up to 96 GB of memory exclusively to the GPU—rivaling the capacity of two high-end graphics cards—and run multiple applications with data transfer rates up to 8000 MT/s.
What we learned: Performance & productivity
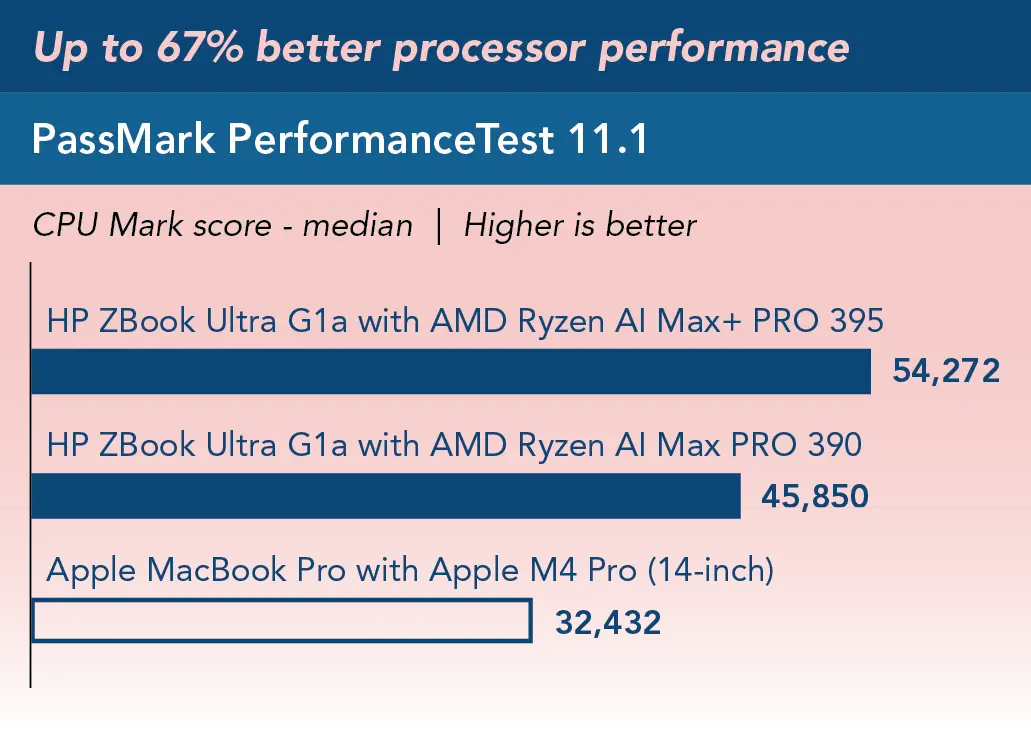
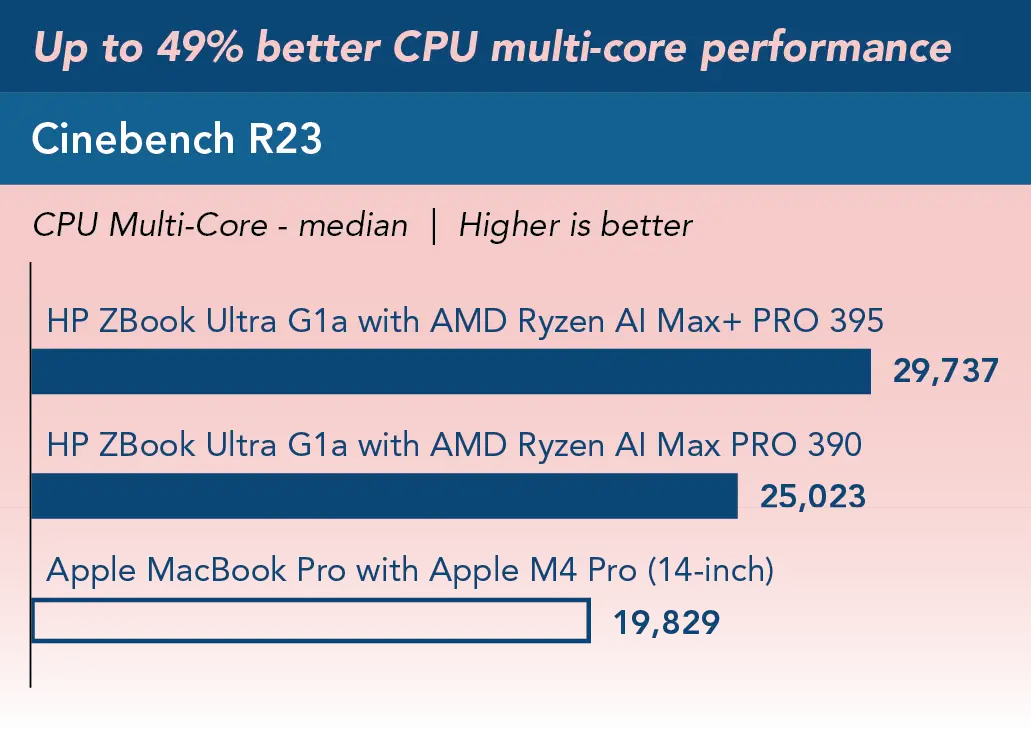
From running design software and editing large files to juggling multiple apps at once, modern workloads can quickly push a mobile device’s limits. Faster and more powerful computing capabilities can boost responsiveness, reduce wait times, and create a smoother overall experience. These improvements can make daily tasks feel easier and help improve productivity when deadlines are tight or when projects are complex. To gauge overall hardware performance of the mobile workstations, we ran two key tests: PassMark PerformanceTest 11.1 and Cinebench R23.
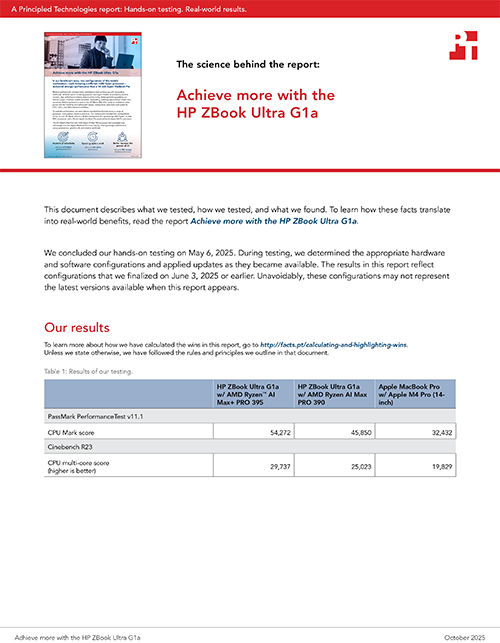
PassMark PerformanceTest 11.1 benchmark suite stresses CPU, 2D and 3D graphics, storage, and memory through different tests. The CPU test executes complex mathematical calculations involving compression, encryption, and physics simulations.8 This score helps with systems comparisons because it reflects raw processing power.
Cinebench R23 tests how fast a CPU can render a 3D scene.9 The faster it finishes, the higher the score. Because it uses many cores at once, the Cinebench multi-core score indicates how a processor might handle demanding, multi-threaded tasks in everyday use in addition to rendering capability.
PassMark PerformanceTest 11.1 CPU Mark score. Source: PT.
Cinebench R23 multi-core scores. Source: PT.
What we learned: Graphics tests
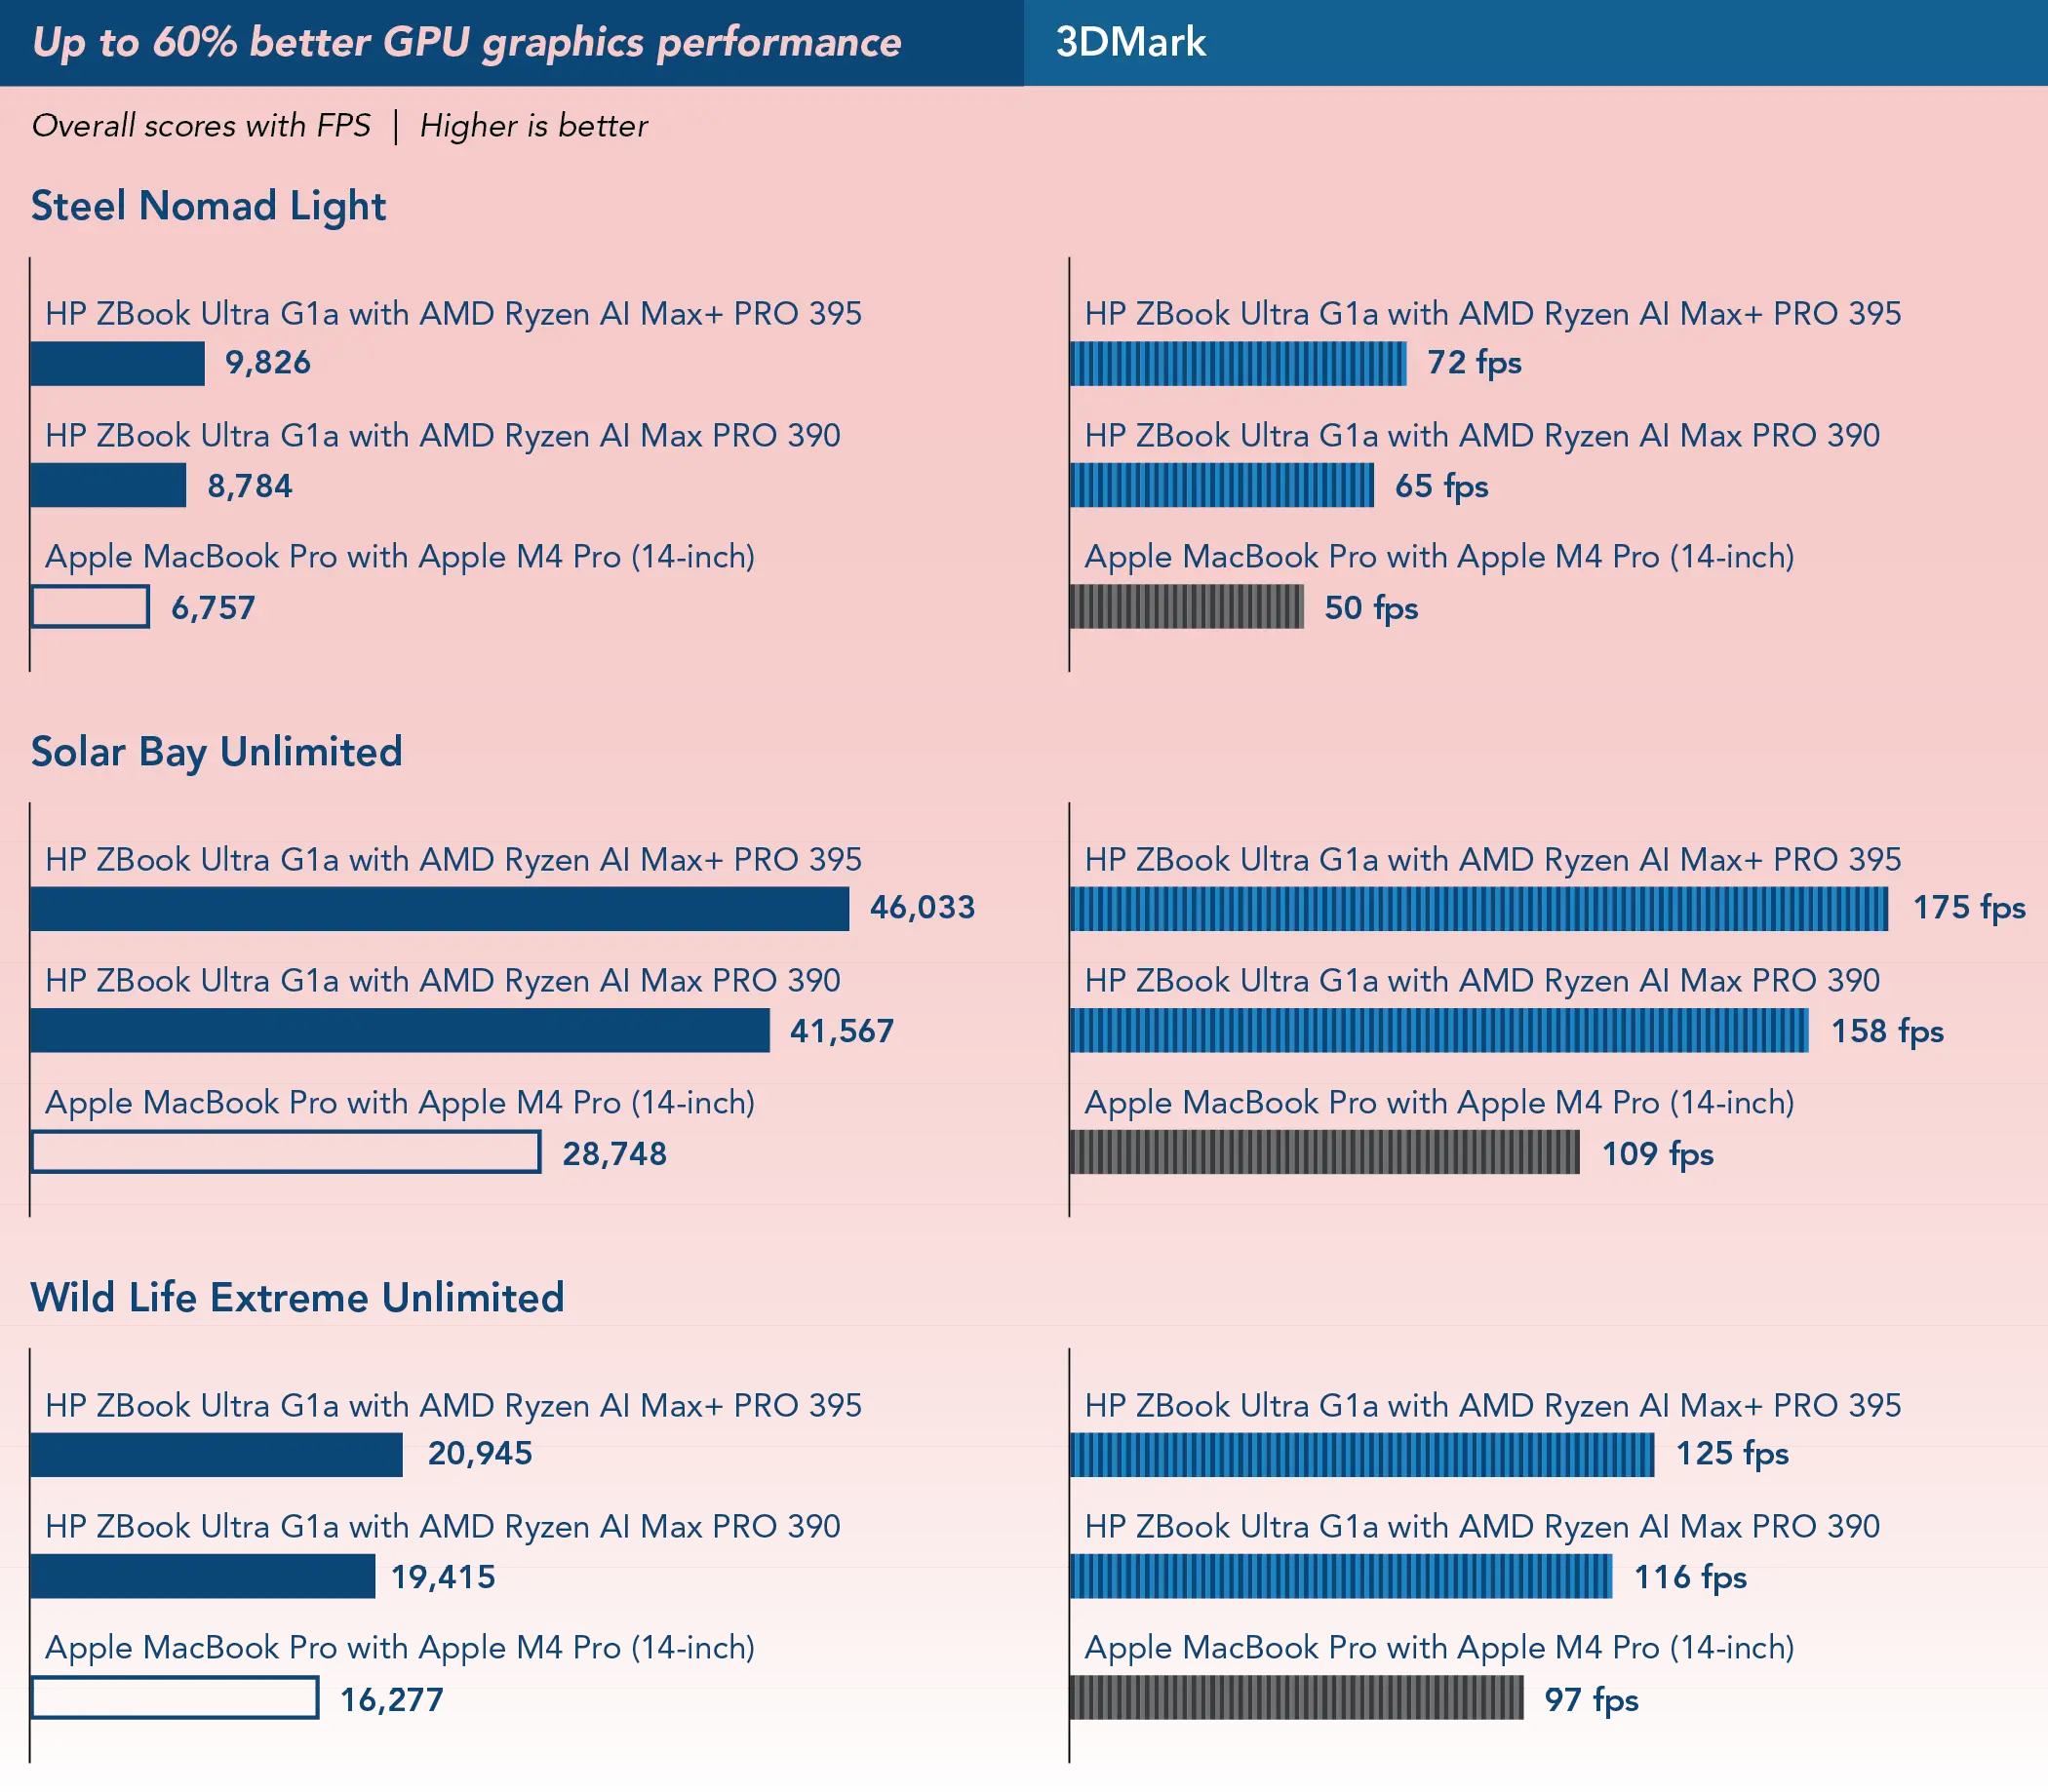
While these mobile workstations are more geared for work than play, strong gaming performance can signal faster response times in graphics-heavy professional workloads such as financial analysis, scientific simulations, and product design. The 3DMark Steel Nomad Light, Solar Bay, and Wildlife Extreme Unlimited tests evaluate a system’s hardware and estimate the frame rates (in frames per second, or FPS) it can deliver during GPU-intensive tasks. In addition to FPS results, the benchmark provides overall scores that make comparing systems straightforward.10 The 3DMark tests we ran do not have CPU components, but if the CPU cannot submit work to the GPU fast enough, it could invalidate the result of the test.
11,12,13
Steel Nomad Light: Multi-threaded benchmark that measures GPU performance with a non-ray traced, game-like workload across DirectX 12, Vulkan 1.1, and Metal
Wild Life Extreme Unlimited: Uses varied geometry, lighting, and effects to deliver consistent chip-to-chip comparisons
Solar Bay Unlimited: Ray-tracing benchmark with reflections, lighting, and effects that runs three progressively demanding scenes using Vulkan 1.1 at 2560×1440 resolution
3DMark workload results. Higher is better. Source: PT.
What we learned: AI tests
As AI models and processes become faster, more capable, and cheaper to run, organizations are integrating them into a growing range of workflows to accelerate decision-making and innovation. Businesses are using AI to automate routine tasks, derive deeper insights from data, and augment human decision-making in complex scenarios. This shift is yielding tangible performance improvements. For example, one field study found that equipping customer service agents with an AI assistant boosted their productivity by about 14 percent, with the largest gains among less-experienced workers.14 The finding underscores how AI-driven transformation can help boost productivity and overall business performance.
Procyon AI Computer Vision Benchmark – float32
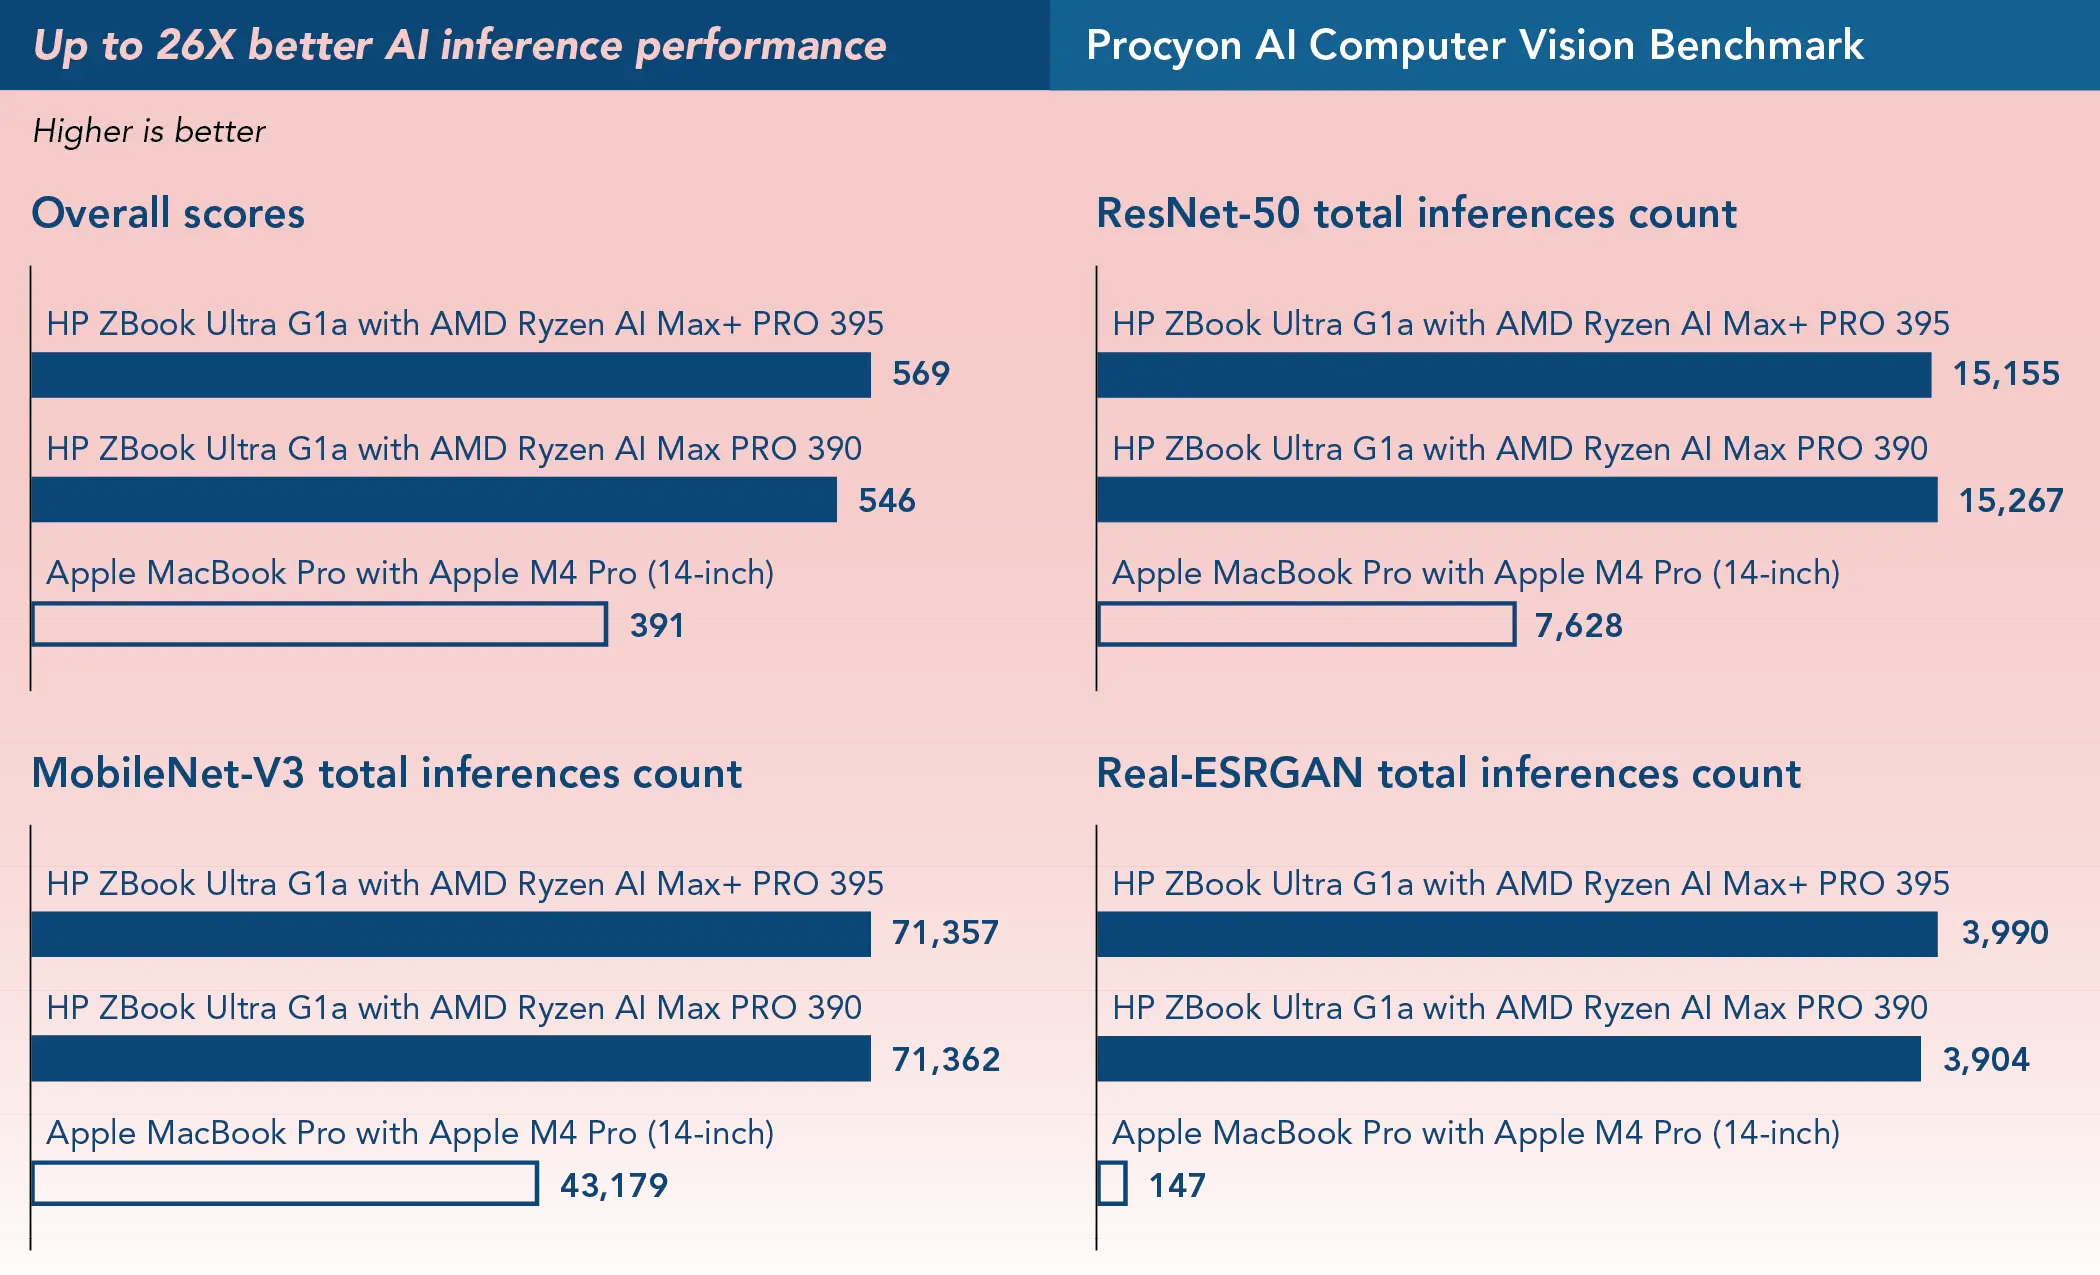
AI and ML technologies are transforming how professionals approach complex tasks, but that innovation requires serious computing power. These workloads are both data- and processor-intensive, making a strong CPU essential for staying productive. Whether it’s running computer vision at the edge, analyzing 3D images, or classifying objects, faster performance can mean finishing tasks sooner and focusing on what comes next. To measure this capability, Procyon AI Computer Vision Benchmark evaluates inference performance across multiple AI engines, delivering an overall score as well as total inference counts per model. In our testing, we used Windows Machine Learning (ML) as the inference engine with the DirectML GPU backend on the two configurations of the HP ZBook Ultra G1a and the Apple Core ML engine for the MacBook, and we ran the following models using the single-precision (FP32) format:15
MobileNetV3 and ResNet-50:16,17,18
Commonly applied in image recognition, object detection, and classification tasks across research, technology, and commercial settings; MobileNetV3 targets mobile devices (e.g., the mobile workstations we tested)
Real-ESRGAN:19Used in industries such as digital media, healthcare, and real estate to improve image clarity and resolution with Generative Adversarial Network (GAN)-based enhancement
Procyon AI Computer Vision Benchmark FP32 workload results. Higher is better. Source: PT
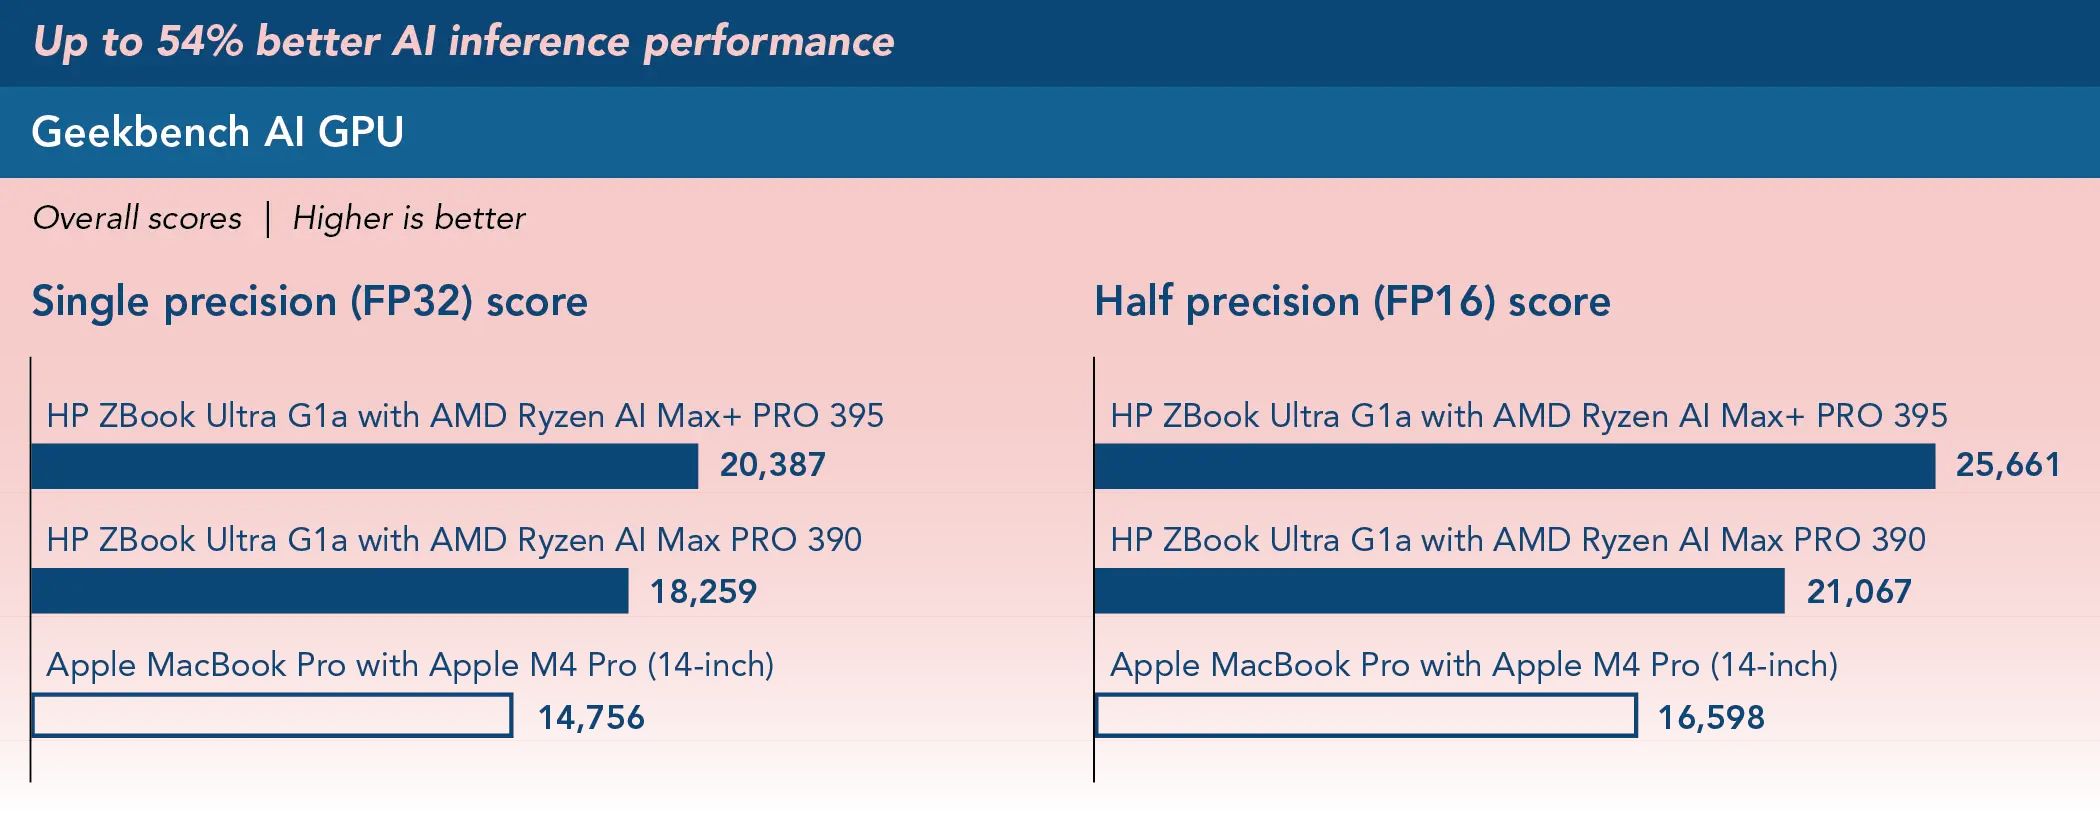
Geekbench AI GPU
Geekbench AI evaluates CPU, GPU, and NPU performance using real-world ML tasks.20 For our testing, we used the Open Neural Network Exchange (ONNX) framework with the DirectML GPU backend on the two HP ZBook Ultra G1a configurations, and the Apple Core ML engine with the GPU backend on the 14-inch MacBook Pro. We ran tests in both single-precision (FP32) and half-precision (FP16) formats. FP32 results are more relevant for workloads that demand accuracy—such as medical imaging or advanced deep learning—while FP16 results are useful for scenarios where speed and efficiency take priority, such as training smaller datasets or models.
Geekbench AI GPU FP32 and FP16 workload results. Higher is better. Source: PT
What we learned: Creative tests
Creative professionals rely on powerful workstations to handle demanding workflows such as video editing, image processing, and digital content creation. These workloads can combine heavy CPU, GPU, and memory usage, so performance directly affects how quickly projects move from concept to completion. Benchmarking creative applications provides insight into how well a workstation can support these real-world tasks, helping deliver potential gains in productivity and responsiveness.
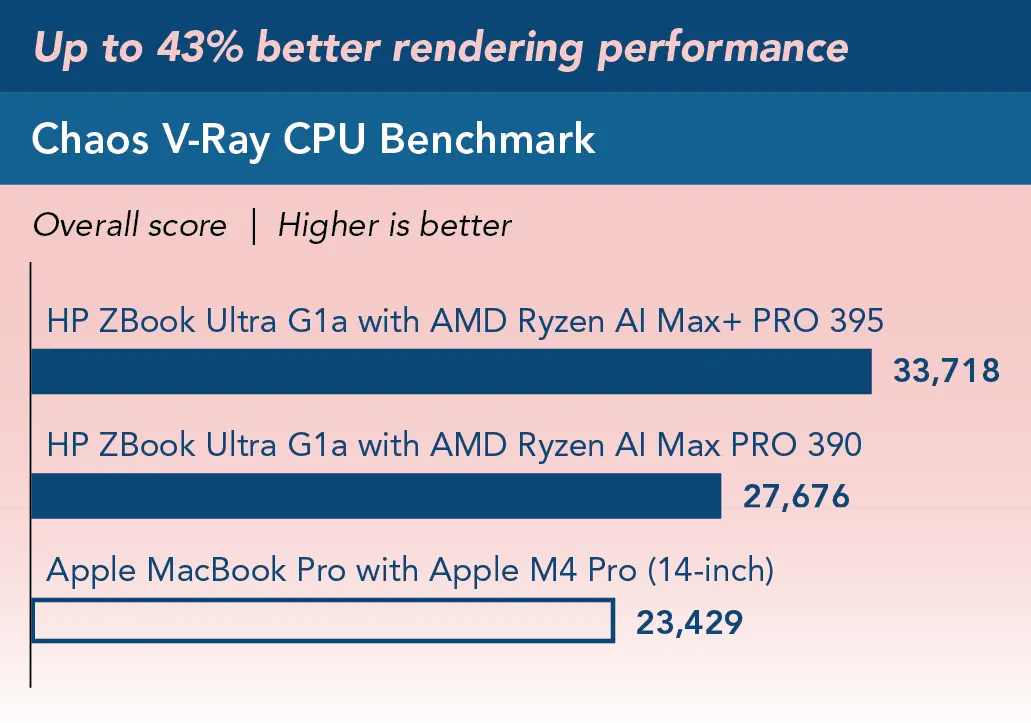
Chaos V-Ray CPU workload results. Higher is better. Source: PT.
The Chaos V-Ray Benchmark measures system rendering performance using CPUs, GPUs, or both together. It evaluates rendering speed with V-Ray 6 engines powered by RTX and CUDA technologies.21
Conclusion
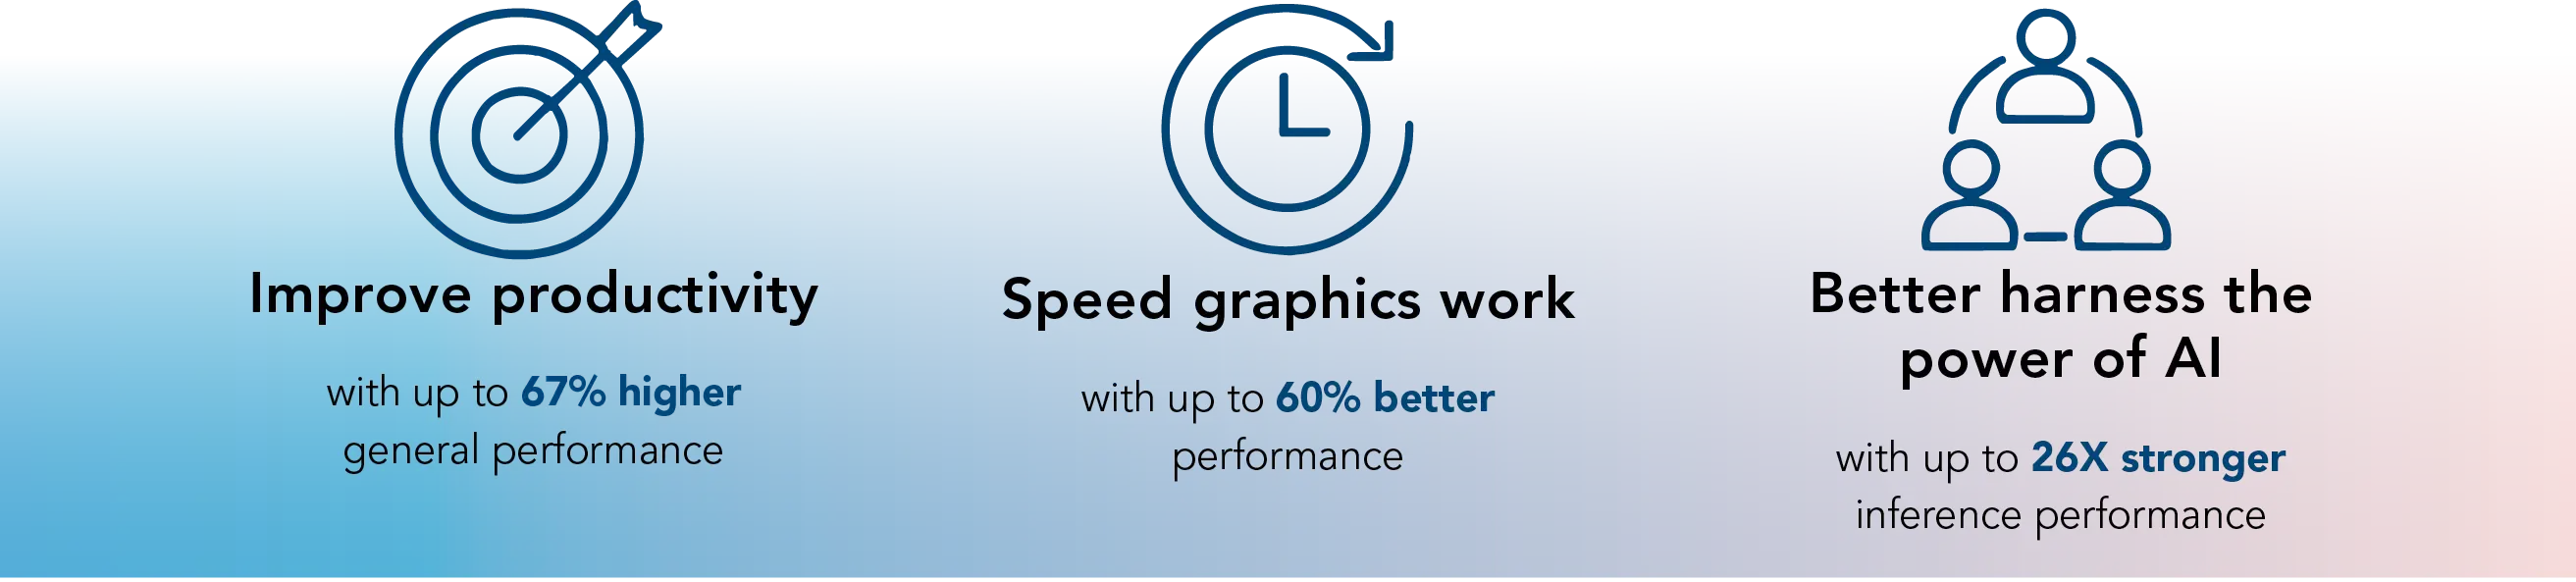
Our testing shows that the HP ZBook Ultra G1a Mobile Workstation PC, powered by an AMD Ryzen™ AI Max PRO processor, outperformed its 14-inch counterpart Apple MacBook Pro in several key workloads. The ZBook Ultra G1a delivered up to 67 percent higher general productivity performance, up to 60 percent better graphics performance, up to 26 times stronger AI inference performance, and up to 43 percent faster rendering performance. In these tests, the ZBook Ultra G1a configuration with the AMD Ryzen AI Max+ PRO 395 processor performed the best, but both AMD Ryzen AI Max PRO processor configurations performed well and better than the 14-inch Apple MacBook Pro with Apple M4 Pro chip. For professionals who rely on mobile systems for these and other CPU-, GPU-, and NPU-intensive workflows, these performance advantages could translate into shorter project timelines, smoother multitasking, and greater flexibility for working on the go. The HP ZBook Ultra G1a combines workstation-class power with mobility, which can help your teams save time and stay productive wherever work happens.
Principled Technologies is a registered trademark of Principled Technologies, Inc.
All other product names are the trademarks of their respective owners.
Principled Technologies disclaimer
Principled Technologies is a registered trademark of Principled Technologies, Inc. All other product names are the trademarks of their respective owners.
DISCLAIMER OF WARRANTIES; LIMITATION OF LIABILITY: Principled Technologies, Inc. has made reasonable efforts to ensure the accuracy and validity of its testing, however, Principled Technologies, Inc. specifically disclaims any warranty, expressed or implied, relating to the test results and analysis, their accuracy, completeness or quality, including any implied warranty of fitness for any particular purpose. All persons or entities relying on the results of any testing do so at their own risk, and agree that Principled Technologies, Inc., its employees and its subcontractors shall have no liability whatsoever from any claim of loss or damage on account of any alleged error or defect in any testing procedure or result.
In no event shall Principled Technologies, Inc. be liable for indirect, special, incidental, or consequential damages in connection with its testing, even if advised of the possibility of such damages. In no event shall Principled Technologies, Inc.’s liability, including for direct damages, exceed the amounts paid in connection with Principled Technologies, Inc.’s testing. Customer’s sole and exclusive remedies are as set forth herein.

 Twitter
 Facebook
 LinkedIn
 Email
Email