A Principled Technologies report: Hands-on testing. Real-world results.
Give your team the freedom to work from anywhere with a Snapdragon X Plus 10-core
processor-powered laptop
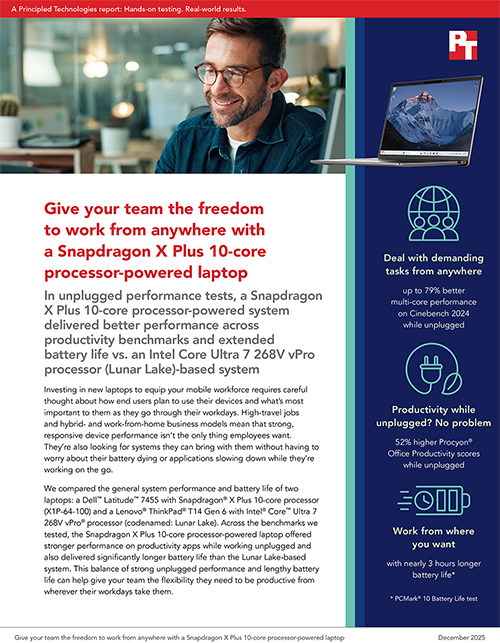
In unplugged performance tests, a Snapdragon X Plus 10-core processor-powered system
delivered better performance across productivity benchmarks and extended battery life vs. an Intel Core Ultra 7
268V vPro processor (Lunar Lake)-based system
Investing in new laptops to equip your mobile workforce requires careful thought about how end
users plan to use their devices and what’s most important to them as they go through their workdays. High-travel
jobs and hybrid- and work-from-home business models mean that strong, responsive device performance isn’t the
only thing employees want. They’re also looking for systems they can bring with them without having to worry
about their battery dying or applications slowing down while they’re working on the go.
We compared the general system performance and battery life of two laptops: a Dell™ Latitude™ 7455 with Snapdragon® X Plus 10-core processor (X1P-64-100) and a Lenovo® ThinkPad® T14 Gen 6 with Intel® Core™ Ultra 7 268V vPro® processor (codenamed: Lunar Lake). Across the benchmarks we tested, the
Snapdragon X Plus 10-core processor-powered laptop offered stronger performance on productivity apps while
working unplugged and also delivered significantly longer battery life than the Lunar Lake-based system. This
balance of strong unplugged performance and lengthy battery life can help give your team the flexibility they
need to be productive from wherever their workdays take them.
Balancing strong performance and long battery life
Today’s workforce is mobile. They may carry their laptop from conference room to conference room
in the office, work from their living room couch, or venture out for a cup of coffee in a cozy atmosphere. These
modern work styles call for a laptop fleet that performs well to keep employees productive while also giving
them the freedom to roam. That’s why it’s critical to assess performance as well as battery life—and to ensure
that the systems you provide your team don’t perform poorly while they’re running on battery.
In our tests, we compared the general unplugged performance and battery life of two systems:
Dell Latitude 7455
Snapdragon X Plus 10-core processor (X1P-64-100) and Qualcomm® Adreno™ GPU, 32GB LPDDR5x memory, 512GB
SSD storage, Windows 11 Pro, 54 Whr battery, 2,560 x 1,600 display
Lenovo ThinkPad T14 Gen 6
Intel Core Ultra 7 Processor 268V vPro (Lunar Lake) and Intel Arc GPU, 32GB LPDDR5x
memory, 512GB SSD storage, Windows 11 Pro, 57Whr battery, 1,920 x 1,200 display
To assess battery life, we set up a ten-person Microsoft Teams videoconference to see how long
each system continued to run this common resource-hungry use case while unplugged. We also ran two battery life
benchmarks to show expected battery life with lighter workloads: PCMark 10 Battery Life and Procyon Battery Life
Benchmark.
We ran several industry-standard benchmarks while the systems were unplugged to form a picture of
the overall productivity performance users might expect when using common apps on the go. These benchmarks
included Cinebench 2024, Geekbench 6, CrossMark, Procyon Office Productivity, and PCMark 10.
We ran these benchmarks in two different Windows 11 power modes:
Balanced, a middle ground option that adjusts power settings based on user activity to
provide a mix of performance and efficiency
Best Power Efficiency, which maximizes battery life by limiting background activity and
performance, which conserves power
For results from our performance tests, visit page 5.
To learn more about the laptops we tested and the details of our testing process, read the science behind the report.
About Snapdragon X Plus 10-core processors
According to Qualcomm, Snapdragon X Plus processors balance high performance and power efficiency, allowing
“users to optimize workloads for productivity without interruption. Say goodbye to lag with incredibly fast
responsiveness.”1 Codenamed Qualcomm Oryon, the Snapdragon X Plus 10-core X1P-64-100
processor integrates a Qualcomm Adreno GPU for strong graphics performance. This Snapdragon X Plus processor
boasts 10 cores, 3.4GHz frequency, and 42MB cache.2 To learn more, visit the Qualcomm Snapdragon X Plus landing page.
Note: The graphs in this report use different scales to keep a consistent size. Please be mindful
of each graph’s data range as you compare.
Spend more time working—wherever you are—with longer battery life
Imagine your flight’s just been canceled, and you’re stuck in the packed airport with nowhere to
plug in your laptop. Your headphones are ready so you can join a scheduled call and get the details about an
upcoming project from your client. But halfway through the crucial details, your laptop shuts down because the
battery died. For critical moments like this, and for better flexibility, end users need the option to work
unplugged for as long as possible.
Microsoft Teams 3x3 video conference
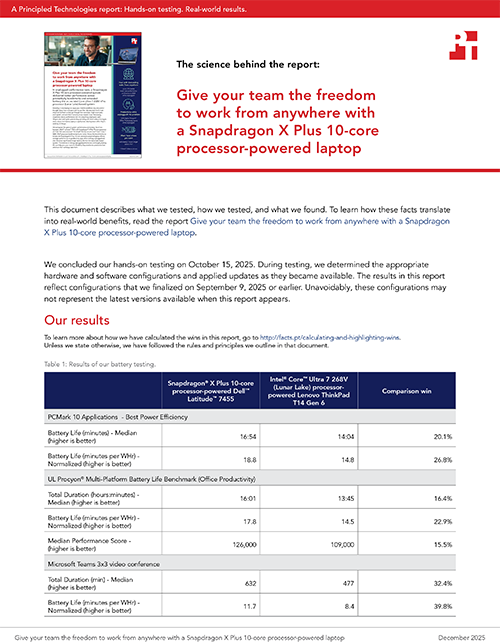
Figure 1 compares the battery life duration and Figure 2 compares the battery efficiency of the
two systems during a Teams videoconference with ten participants. The Snapdragon X Plus 10-core
processor-powered laptop lasted for two and a half hours longer during the meeting than the Lunar Lake
processor-based system.
Battery life duration, in hours and minutes, during a Teams meeting while unplugged. Source: PT.
Battery efficiency, in minutes per watt-hour, during a Teams meeting while unplugged. Source: PT.
Procyon Battery Life Benchmark
The Procyon Battery Life Benchmark gives another look at battery life, this time using real-world
scenarios around office productivity, which is less taxing than a video conference.3 In this test, the Snapdragon X Plus
10-core processor-powered laptop lasted over 2 hours longer than the Lunar Lake processor-based system and
delivered a 15 percent higher performance score (see Figures 3 and 4).
Battery life duration, in hours and minutes, during the Procyon Battery Life Benchmark test while in Best
Power Efficiency mode. Source: PT.
Median performance score on the Procyon Battery Life Benchmark test while in Best Power Efficiency mode.
Source:
PCMark 10 Battery Life - Best Power Efficiency
Finally, we tested battery life using the PCMark10 Battery Life test, which provides a broad
view of battery life across Microsoft Office and Microsoft Edge workloads.”4 In this test, the Snapdragon X
Plus 10-core processor-powered laptop battery lasted nearly 3 hours longer than the Lunar Lake processor-based
system did (see Figure 5).
Battery life duration, in hours and minutes, during the PCMark 10 Battery Life Test while in Best Power
Efficiency mode. Source: PT.
Stronger unplugged performance = better productivity on to go
Because mobile workers have various workflows they need to handle on their laptops while they
can’t be plugged in, it’s crucial to look at demanding tasks (such as graphics rendering) as well as
responsiveness on more generalized office productivity tasks. Across the benchmarks we tested, the Snapdragon
X Plus 10-core processor-powered laptop outperformed its Lunar Lake processor-based competitor.
Cinebench 2024
The Cinebench 2024 benchmark renders images and video to evaluate computers’ CPU and GPU
capabilities.5 While both systems were in Balanced mode, the Snapdragon X Plus 10-core
processor-powered laptop achieved a 79 percent higher Multi-core score and a 54 percent higher Single-core
score than the Lunar Lake processor-based system (see Figure 6).
Cinebench 2024 performance comparison, while unplugged and in Balanced mode. Source: PT.
While both systems were in Best Power Efficiency mode, the Snapdragon X Plus 10-core
processor-powered laptop achieved a 30 percent higher Multi-core score and an 18 percent higher Single-core
score than the Lunar Lake processor-based system (see Figure 7).
Cinebench 2024 performance comparison, while unplugged and in Best Power Efficiency mode. Source: PT.
Geekbench 6
Geekbench 6 is another benchmark that measures both single-core and multi-core processing power
“for everything from checking your email to taking a picture to playing music, or all of it at once. [It] also
measures performance in new application areas including Augmented Reality and Machine Learning.”6
As Figure 8 shows, in Balanced mode, the Snapdragon X Plus 10-core processor-powered laptop
achieved a 28 percent higher Multi-core score and a 97 percent higher Single-core score than the Lunar Lake
processor-based system.
In Best Power Efficiency mode, the Snapdragon X Plus 10-core processor-powered laptop achieved a
6 percent lower Multi-core score and a 43 percent higher Single-core score than the Lunar Lake processor-based
system (see Figure 9).
Geekbench 6 performance comparison, while unplugged and in Balanced mode. Source: PT.
Geekbench 6 performance comparison, while unplugged and in Best Power Efficiency mode. Source: PT.
CrossMark v1.0.1.95
CrossMark is a “cross-platform benchmark that measures the overall system performance and system
responsiveness using models of real-world applications.”7 In Balanced mode, the Snapdragon X Plus 10-core
processor-powered laptop achieved a 21 percent higher score than the Lunar Lake processor-based system (see
Figure 10).
In Best Power Efficiency mode, the Snapdragon X Plus 10-core processor-powered laptop achieved a
1 percent higher score than the Lunar Lake processor-based system (see Figure 11).
CrossMark v1.0.1.95 performance comparison, while unplugged and in Balanced mode. Source: PT.
CrossMark v1.0.1.95 performance comparison, while unplugged and in Best Power Efficiency mode. Source: PT.
Procyon Office Productivity benchmark
We compared the systems’ unplugged performance for general productivity using the Procyon Office
Productivity benchmark, which “uses Microsoft Office applications to measure Windows PC and Apple Mac
performance in office productivity tasks. The benchmark workloads are built on relevant, real-world tasks
using Microsoft Word, Excel, PowerPoint and Outlook.”8 As Figure 12 shows, in Balanced mode, the Snapdragon X
Plus 10-core processor-powered laptop achieved a 52 percent better overall rating than the Lunar Lake
processor-based system.
In Best Power Efficiency mode, the Snapdragon X Plus 10-core processor-powered laptop achieved a
26 percent better overall rating than the Lunar Lake processor-based system (see Figure 13).
Procyon Office Productivity benchmark ratings, while unplugged and in Balanced mode. Source: PT.
Procyon Office Productivity benchmark ratings, while unplugged and in Best Power Efficiency mode. Source:
PT.
PCMark 10
PCMark 10 is another general performance benchmark that measures the performance of Windows
systems across a wide variety of real-world applications and activities.9 Again, the Snapdragon X Plus
10-core processor-powered laptop outperformed the Lunar Lake processor-based system, achieving a 26 percent
higher overall rating in Balanced mode and approximately the same overall rating in Best Power Efficiency mode
(see Figures 14 and 15).
PCMark 10 overall ratings, while unplugged and in Balanced mode. Source: PT.
PCMark 10 overall ratings, while unplugged and in Best Power Efficiency mode. Source: PT.
Conclusion
When your workforce travels or has the flexibility to work from home, top-tier laptop specs
alone isn’t enough. Employees also need laptops they can reliably take anywhere, without concerns about their
battery running out or their applications slowing down during critical moments. Based on our test results,
upgrading your laptop fleet with systems powered by Snapdragon X Plus 10-core processors (X1P-64-100) like the
Dell Latitude 7455 we tested could meet these joint needs better than an Intel Core Ultra 7 268V vPro (Lunar
Lake) processor-based system.
With up to 52 percent better general performance and nearly 3 hours longer battery life than an
Intel Core Ultra 7 268V vPro (Lunar Lake) processor-based system, the Snapdragon X Plus-powered Dell Latitude
7455 is a solid upgrade target for your laptop fleet. Give your team the tools they need to work productivity
from anywhere with a laptop powered by Snapdragon X Plus 10-core processors.
This project was commissioned by Dell Technologies.
December 2025
Principled Technologies is a registered trademark of Principled Technologies, Inc.
All other product names are the trademarks of their respective owners.
Principled Technologies disclaimer
Principled Technologies is a registered trademark of Principled Technologies, Inc. All other product names are the trademarks of their respective owners.
DISCLAIMER OF WARRANTIES; LIMITATION OF LIABILITY: Principled Technologies, Inc. has made reasonable efforts to ensure the accuracy and validity of its testing, however, Principled Technologies, Inc. specifically disclaims any warranty, expressed or implied, relating to the test results and analysis, their accuracy, completeness or quality, including any implied warranty of fitness for any particular purpose. All persons or entities relying on the results of any testing do so at their own risk, and agree that Principled Technologies, Inc., its employees and its subcontractors shall have no liability whatsoever from any claim of loss or damage on account of any alleged error or defect in any testing procedure or result.
In no event shall Principled Technologies, Inc. be liable for indirect, special, incidental, or consequential damages in connection with its testing, even if advised of the possibility of such damages. In no event shall Principled Technologies, Inc.’s liability, including for direct damages, exceed the amounts paid in connection with Principled Technologies, Inc.’s testing. Customer’s sole and exclusive remedies are as set forth herein.


 Twitter
 Facebook
 LinkedIn
 Email
Email