
A Principled Technologies report: Hands-on testing. Real-world results.

HP ZBook Fury G1i 18": Supercharge 3D model creation and manipulation
We compared graphics and AI performance and battery life on HP ZBook Fury G1i 18" and Dell Pro Max 18 Plus mobile workstations
3D software has intensive hardware requirements, and modeling, texturing, and animating 3D projects can be time-consuming. This is a challenge for anyone working on a tight deadline or with limited resources. To set yourself up for success, it makes sense to get the most out of your next mobile workstation purchase.
HP ZBook Fury G1i mobile workstations are equipped with Intel® Core™ Ultra 200HX series CPUs and NVIDIA RTX PRO™ Blackwell Generation Laptop GPUs. These professional-grade processors are purpose-built for the next generation of on-the-go creators and promise to deliver groundbreaking AI and graphics performance.1,2 But is investing in a mobile workstation with those components enough to supercharge your 3D design efforts?
We compared HP ZBook Fury G1i 18" and Dell Pro Max 18 Plus mobile workstations with identical Intel® vPro® with Intel® Core™ Ultra 9 285HX processors and NVIDIA RTX PRO™ 5000 Blackwell Generation Laptop GPUs. Then, we ran multiple benchmarks to compare system performance and battery life. You might be surprised by what we found—read on for more.
What we tested
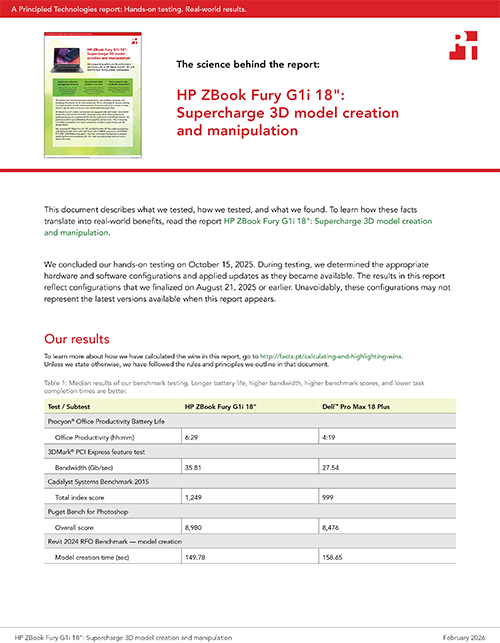
We compared performance and battery life on two Windows 11 Pro mobile workstations with 64 GB of memory, 1 TB of storage, and the same CPU and graphics:
HP ZBook Fury G1i 18" equipped with an Intel® Core™ Ultra 9 285HX processor with Intel® vPro®, NVIDIA RTX PRO™ 5000 Blackwell Generation Laptop GPU, 64 GB of DDR5 5600 SODIMM memory, an 18-inch LED display with a peak resolution of 2,560 x 1,600, and a 99-Wh battery
Dell Pro Max 18 Plus equipped with an Intel® Core™ Ultra 9 285HX processor with Intel® vPro®, NVIDIA RTX PRO™ 5000 Blackwell Generation Laptop GPUs, 64 GB of DDR5 6400 CSoDIMM memory, an 18-inch LCD display with a peak resolution of 2,560 x 1,600, and a 96-Wh battery
For a wide-ranging performance evaluation, we ran these benchmarks three times and report the median results:
- 3DMark
- Cadalyst Systems Benchmark using AutoCAD 2026
- Procyon AI Computer Vision Benchmark
- Puget Bench for Photoshop
- Revit 2024 RFO Benchmark
- SPECapc® for Creo 9
We also measured battery life using the Procyon Battery Life Benchmark with the Windows 11 power mode set to Best power efficiency.
Note: The graphs in this report use different scales to keep a consistent size. Please be mindful of each graph’s data range as you compare.
Experience extended unplugged productivity
Long battery life is a game changer. When you’re not constantly worried that your battery’s about to die, you can choose the best seat for an important meeting instead of one that’s close to an outlet. And you can work on the go, confident that you have multiple hours of battery life at your disposal. Procyon Battery Life Benchmark has multiple workload options. We chose the Office Productivity workload, which simulates a typical workday using real-world Microsoft 365 applications.5 We found that the HP ZBook Fury G1i 18", with its 55W (99-Whr) battery and LED display delivered 50 percent longer battery life than the Dell Pro Max 18 Plus, with its 55W (96-Whr battery and LCD display).

Better support data-intensive applications
In addition to processor performance, we need to talk about bandwidth, or how much data each workstation can transmit among components during a given time. Computers achieve this through a PCI Express (PCIe®) interface. The 3DMark PCI Express feature test measures the gigabits per second (GB/s) available to each workstation’s GPU through the system’s PCIe interface.6 Higher PCIe bandwidth, like what the HP system delivered in our testing, can help accelerate machine learning (ML), 3D rendering, and scientific simulation workflows.7

Get the power you need to tackle bigger projects
Whether you’re a mechanical engineer, product designer, or architect, design and drafting are a huge part of your job. So, even though the following benchmarks deal with specific industry-standard software, you can gain insights into your likely performance regardless of your specialty. For example, as an architect or product designer, you might use AutoCAD and Revit® for initial modeling and switch to Adobe Photoshop® for artistic rendering and presentation graphics.8,9
Cadalyst System Benchmark 2015 measures 3D graphics, 2D graphics, disk, and CPU performance using AutoCAD 2026 and produces a total index score.10

Puget Bench for Photoshop measures photo-editing performance using Adobe Photoshop.11 It mostly stresses the CPU and GPU. The overall score, based on how long it takes to complete general and filter tests, gives insight into how the systems under test could perform in production environments.

Revit 2024 RFO Benchmark measures model creation, rendering, exporting, and graphics performance when using Autodesk® Revit 2024.12 According to Autodesk, “the speed at which the CPU sends data to the GPU will impact graphical performance,” as will how quickly the RAM and storage deal with data.13 That makes these numbers matter to more than the professionals who use Revit software.


SPECapc for Creo 9 measures graphics, CPU, and I/O performance using Creo 9, CAD software for creating 3D models “that [allow] engineers to conceptualize, design, analyze, and validate products.”14 Higher scores here can translate to a more responsive user experience when working on graphics-intensive tasks.

Get actionable data insights in less time
Whether you’re using computer vision to convert sketches into 3D CAD models or interpret visual information, the more capably a workstation can handle those AI-enhanced workflows, the better.
We used the Procyon AI Computer Vision Benchmark to measure on-device inference performance, stressing the NVIDIA RTX PRO™ 5000 Blackwell Laptop GPUs at different precision levels.15 Float32 precision uses 32-bit calculations for situations where high-accuracy data insights are more vital than speed and efficiency. Float16 uses 16-bit calculations to provide data insights in situations where speed and efficiency are more valuable. Int8 is the lowest precision level, ideal for situations where you need to heavily prioritize speed and efficiency over accuracy.


Conclusion
When we tested comparably configured HP ZBook Fury G1i 18" and Dell Pro Max 18 Plus mobile workstations, we found that the HP ZBook system delivered 50 percent longer battery life and received higher scores across multiple industry-standard benchmarks. Longer unplugged productivity lets you work where you want and when you need to, and stronger benchmark performance means you have the potential to projects finish faster and accelerate creative iteration. Think of the possibilities.

 Twitter
 Facebook
 LinkedIn
 Email
Email- Intel press release, “Intel Expands Leadership in AI PCs and Edge Computing at CES 2025,” accessed December 8, 2025, https://www.intc.com/news-events/press-releases/detail/1722/intel-extends-leadership-in-ai-pcs-and-edge-computing-at.
- NVIDIA press release, “NVIDIA Blackwell RTX PRO Comes to Workstations and Servers for Designers, Developers, Data Scientists and Creatives to Build and Collaborate with Agentic AI,” accessed December 8, 2025, https://nvidianews.nvidia.com/news/nvidia-blackwell-rtx-pro-workstations-servers-agentic-ai.
- “HP ZBook Fury G1i,” accessed December 11, 2025, https://www.hp.com/us-en/workstations/zbook-fury.html.
- “HP ZBook Fury G1i.”
- UL Solutions, “Procyon® Battery Life Benchmark,” accessed December 10, 2025, https://benchmarks.ul.com/procyon/battery-life-benchmark.
- 3DMark, “Overview of the 3DMark PCI Express feature test,” accessed December 8, 2025, https://support.benchmarks.ul.com/support/solutions/articles/44002136942-overview-of-the-3dmark-pci-express-feature-test.
- Massed Compute, “How does PCIe bandwidth impact the performance of a GPU?” accessed December 11, 2025, https://massedcompute.com/faq-answers/.
- Autodesk, “Revit vs. AutoCAD,” accessed December 11, 2025, https://www.autodesk.com/sg/solutions/revit-vs-autocad.
- NGD Blog, “AutoCAD vs Photoshop: Your 2025 Guide for Designers,” accessed December 17, 2025, https://ngdblog.africa/autocad-vs-photoshop-your-2025-guide-for-designers/.
- Cadalyst, “Test Your Hardware Systems Running AutoCAD 2026 or Earlier,” accessed December 11, 2025, https://info.cadalyst.com/cad-benchmark-test.
- Puget Systems, “Puget Bench for Photoshop,” accessed December 8, 2025, https://www.pugetsystems.com/pugetbench/creators/photoshop/.
- Autodesk, “What graphics card will provide the best performance in Revit?” accessed December 8, 2025, https://www.autodesk.com/support/technical/article/caas/sfdcarticles/sfdcarticles/Revit-What-Graphics-card-will-give-the-best-performance.html.
- Autodesk, “What graphics card will provide the best performance in Revit?”
- SPEC GWPG, “SPECapc® for Creo 9,” accessed December 11, 2025, https://gwpg.spec.org/benchmarks/benchmark/specapc-ptc-creo-9/.
- UL Solutions, “Procyon® AI Computer Vision Benchmark,” accessed December 11, 2025. https://benchmarks.ul.com/procyon/ai-inference-benchmark-for-windows.
This project was commissioned by HP.
February 2026
Principled Technologies is a registered trademark of Principled Technologies, Inc.
All other product names are the trademarks of their respective owners.
Principled Technologies disclaimer
Principled Technologies is a registered trademark of Principled Technologies, Inc.
All other product names are the trademarks of their respective owners.
DISCLAIMER OF WARRANTIES; LIMITATION OF LIABILITY:
Principled Technologies, Inc. has made reasonable efforts to ensure the accuracy and validity of its testing, however, Principled Technologies, Inc. specifically disclaims any warranty, expressed or implied, relating to the test results and analysis, their accuracy, completeness or quality, including any implied warranty of fitness for any particular purpose. All persons or entities relying on the results of any testing do so at their own risk, and agree that Principled Technologies, Inc., its employees and its subcontractors shall have no liability whatsoever from any claim of loss or damage on account of any alleged error or defect in any testing procedure or result.
In no event shall Principled Technologies, Inc. be liable for indirect, special, incidental, or consequential damages in connection with its testing, even if advised of the possibility of such damages. In no event shall Principled Technologies, Inc.’s liability, including for direct damages, exceed the amounts paid in connection with Principled Technologies, Inc.’s testing. Customer’s sole and exclusive remedies are as set forth herein.
Image close up


