
A Principled Technologies report: Hands-on testing. Real-world results.

Cross the finish line first with the HP ZBook Fury G1i 16"
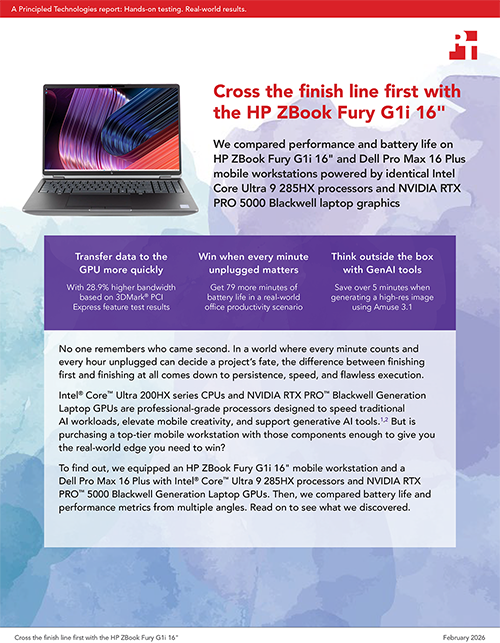
We compared performance and battery life on HP ZBook Fury G1i 16" and Dell Pro Max 16 Plus mobile workstations powered by identical Intel Core Ultra 9 285HX processors and NVIDIA RTX PRO 5000 Blackwell laptop graphics
No one remembers who came second. In a world where every minute counts and every hour unplugged can decide a project’s fate, the difference between finishing first and finishing at all comes down to persistence, speed, and flawless execution.
Intel® Core™ Ultra 200HX series CPUs and NVIDIA RTX PRO™ Blackwell Generation Laptop GPUs are professional-grade processors designed to speed traditional AI workloads, elevate mobile creativity, and support generative AI tools.1,2 But is purchasing a top-tier mobile workstation with those components enough to give you the real-world edge you need to win?
To find out, we equipped an HP ZBook Fury G1i 16" mobile workstation and a Dell Pro Max 16 Plus with Intel® Core™ Ultra 9 285HX processors and NVIDIA RTX PRO™ 5000 Blackwell Generation Laptop GPUs. Then, we compared battery life and performance metrics from multiple angles. Read on to see what we discovered.
What we tested
We compared two mobile workstations with 64 GB of memory, 1 TB of storage, and the same CPU and graphics:
HP ZBook Fury G1i 16” equipped with an Intel® Core™ Ultra 9 285HX processor with Intel vPro®, an NVIDIA RTX PRO™ 5000 Blackwell Generation Laptop GPU, 64 GB of DDR5-5600 MT/s SODIMM, a 16-inch LED display with a peak resolution of 3,840 x 2,400, and a 99-Whr battery
Dell Pro Max 16 Plus equipped with an Intel® Core™ Ultra 9 285HX processor with Intel vPro®, an NVIDIA RTX PRO™ 5000 Blackwell Generation Laptop GPU, 64 GB of DDR5-6400 MT/s CSoDIMM memory, a 16-inch LCD display with a peak resolution of 3,840 x 2,400, and a 96-Whr battery
To see who crossed the finish line first in a variety of contests, we utilized benchmarks that measure everything from general productivity to content creation, generative AI (GenAI) capabilities, 3D design and engineering tasks, and timed collateral exports:
- 3DMark
- Amuse 3.1
- PCMark 10
- Procyon Video Editing Benchmark
- Puget Bench for Photoshop
- Revit 2024 RFO Benchmark
- SPECapc for Solidworks 2024
We also measured real-world battery life using the Procyon Office Productivity Battery Life Benchmark with the Windows 11 power mode set to Best power efficiency.
Note: The graphs in this report use different scales to keep a consistent size. Please be mindful of each graph’s data range as you compare.
When every hour unplugged matters
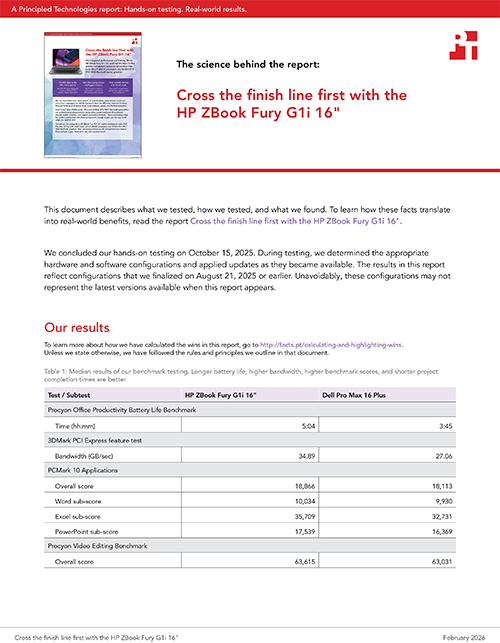
Your goal is focusing on your work, not looking for an available outlet. Whether you’re grabbing the best seat for an important meeting or sharing your ideas on the spur of the moment, knowing that your battery isn’t going to conk out at a critical moment is a game changer. Procyon Battery Life Benchmark results are relatable because the office productivity benchmark simulates a typical workday using real-world Microsoft 365 applications.5 We found that the HP ZBook Fury G1i 16" delivered an hour and 19 minutes more battery life in an office productivity scenario than a Dell Pro Max 16 Plus.

The important role component communication plays
Before we dive into our workload-based system performance results, we need to talk about a contributing factor in the overarching performance story: How much data each workstation can transmit between components at any given time. It’s called bandwidth, and computers achieve this through a PCI Express (PCIe®) interface. The 3DMark PCI Express feature test measures the bandwidth (GB/sec) available to your GPU through the system’s PCIe interface.6 With higher bandwidth—which the HP system delivered in our testing—programs can transfer more data, users experience reduced load times, and the workstation itself can handle more complex scenes.7

Don’t let day-to-day activities slow you down
PCMark 10 Applications measures general performance when using Microsoft 365 applications.8 It primarily stresses the CPU and RAM. Technical professionals should pay attention to these sub-scores: With 9.0 percent higher Excel and 7.1 percent higher PowerPoint sub-scores, the ZBook Fury G1i 16” proved itself more capable of handling complex calculations, making it easier to crunch through large datasets.

While the following content creation benchmark results were close, it’s important to recognize that even a small performance gain can boost productivity. When you factor in the number of times someone completes a single task or workflow over the course of a day, a week, or even a month, every second saved can make a long-term impact.
Procyon Video Editing Benchmark measures video-editing performance using Adobe® Premiere® Pro.9 The overall score is based on the time it takes to export four videos, with performance based on how well the CPU, GPU, and storage work together.10 These results are pertinent to anyone who routinely exports large files, handles large datasets, or runs simulations.

PugetBench for Photoshop measures photo-editing performance using Adobe Photoshop®.11 It mostly stresses the CPU and GPU. The overall score is based on how long it takes to complete general and filter tests. This gives insight into how the systems under test will perform in production environments.

Power your 3D design and engineering workflows
Revit 2024 RFO Benchmark measures model creation, rendering, exporting, and graphics performance when using Autodesk® Revit® 2024.12 According to Autodesk, “the speed at which the CPU sends data to the GPU will impact graphical performance” and how quickly the RAM and storage deal with data will also affect Revit performance.13 Because Revit projects typically go through multiple iterations and require input from various shareholders, we measured times for multiple tasks. That makes these numbers matter to more than the professionals who use this particular software.


SPECapc for Solidworks 2024 measures rendering, simulation, and rebuilding performance when using Solidworks 2024.14 The benchmark includes CPU tests that perform rebuild, simulation, conversion, and visualize CPU rendering on in-memory models that range in size from 392 MB to 2.3 GB.15 These results are compelling for anyone who uses CAD software, scientific applications, and 3D rendering engines.

Think outside the box with GenAI tools
To measure the speed and efficiency of each laptop’s handling of resource-intensive GenAI tasks, we generated images and videos with the AI art creation tool, Amuse 3.1.16 Amuse 3.1 uses stable diffusion models to generate images and videos using prompts.17 In our testing, the image generation times were longer than the video generation times because for images, Amuse 3.1 uses a model optimized for fine-grained detail and photorealism;18 for videos, it uses a model optimized for speed.19

Conclusion
When we tested HP ZBook Fury G1i 16" and Dell Pro Max 16 Plus mobile workstations with identical Intel® Core™ Ultra 9 285HX processors and NVIDIA RTX PRO™ 5000 Blackwell Generation Laptop GPUs, we found that the HP ZBook Fury G1i 16" lasted 35 percent longer unplugged and received consistently stronger general productivity and content creation benchmark scores. Yes, some of the results were very close—but you’d expect that from mobile workstations equipped with the same processors, graphics, memory, and storage. What’s more interesting is what you can accomplish with even the slightest advantage at your fingertips.

 Twitter
 Facebook
 LinkedIn
 Email
Email- Intel press release, “Intel Expands Leadership in AI PCs and Edge Computing at CES 2025,” accessed December 8, 2025, https://www.intc.com/news-events/press-releases/detail/1722/intel-extends-leadership-in-ai-pcs-and-edge-computing-at.
- NVIDIA press release, “NVIDIA Blackwell RTX PRO Comes to Workstations and Servers for Designers, Developers, Data Scientists and Creatives to Build and Collaborate with Agentic AI,” accessed December 8, 2025, https://nvidianews.nvidia.com/news/nvidia-blackwell-rtx-pro-workstations-servers-agentic-ai.
- “HP ZBook Fury G1i,” accessed December 8, 2025, https://www.hp.com/us-en/workstations/zbook-fury.html.
- “HP ZBook Fury G1i.”
- UL Solutions, “Procyon® Battery Life Benchmark,” accessed December 8, 2025, https://benchmarks.ul.com/procyon/battery-life-benchmark.
- 3DMark, “Overview of the 3DMark PCI Express feature test,” accessed December 8, 2025, https://support.benchmarks.ul.com/support/solutions/articles/44002136942-overview-of-the-3dmark-pci-express-feature-test.
- 3DMark, “Overview of the 3DMark PCI Express feature test.”
- UL Solutions, “Overview of PCMark 10 Applications benchmark,” accessed Decvember 8, 2025, https://support.benchmarks.ul.com/support/solutions/articles/44002171190.
- UL Solutions, “Procyon® Video Editing Benchmark,” accessed December 8, 2025, https://benchmarks.ul.com/procyon/video-editing-benchmark.
- Hilbert Hagedoom, “UL Launches new Procyon Benchmark suite to help content creators choose a PC,” accessed December 8, 2025, https://www.guru3d.com/story/ul-launches-new-procyon-benchmark-suite-to-help-content-creators-choose-a-pc/.
- Puget Systems, “Puget Bench for Photoshop,” accessed December 8, 2025, https://www.pugetsystems.com/pugetbench/creators/photoshop/.
- Autodesk, “What graphics card will provide the best performance in Revit?” accessed December 8, 2025, https://www.autodesk.com/support/technical/article/caas/sfdcarticles/sfdcarticles/Revit-What-Graphics-card-will-give-the-best-performance.html.
- Autodesk, “What graphics card will provide the best performance in Revit?”
- SPEC GWPG, “SPECapc® for Solidworks 2024 Benchmark,” accessed December 8, 2025, https://gwpg.spec.org/benchmarks/benchmark/specapc-solidworks-2024/.
- SPEC GWPG, “SPECapc® for Solidworks 2024 Benchmark.”
- TensorStack.AI, “Amuse,” accessed December 8, 2025, https://huggingface.co/TensorStack/Amuse.
- TensorStack.AI, “Amuse.”
- AMD, “Introducing The World’s First BF16 Model for SD 3.0 Medium – Try Now in Amuse 3.1,” accessed December 8, 2025, https://www.amd.com/en/blogs/2025/worlds-first-bf16-sd3-medium-npu-model.html.
- AMD, “Introducing The World’s First BF16 Model for SD 3.0 Medium – Try Now in Amuse 3.1.”
This project was commissioned by HP.
February 2026
Principled Technologies is a registered trademark of Principled Technologies, Inc.
All other product names are the trademarks of their respective owners.
Principled Technologies disclaimer
Principled Technologies is a registered trademark of Principled Technologies, Inc.
All other product names are the trademarks of their respective owners.
DISCLAIMER OF WARRANTIES; LIMITATION OF LIABILITY:
Principled Technologies, Inc. has made reasonable efforts to ensure the accuracy and validity of its testing, however, Principled Technologies, Inc. specifically disclaims any warranty, expressed or implied, relating to the test results and analysis, their accuracy, completeness or quality, including any implied warranty of fitness for any particular purpose. All persons or entities relying on the results of any testing do so at their own risk, and agree that Principled Technologies, Inc., its employees and its subcontractors shall have no liability whatsoever from any claim of loss or damage on account of any alleged error or defect in any testing procedure or result.
In no event shall Principled Technologies, Inc. be liable for indirect, special, incidental, or consequential damages in connection with its testing, even if advised of the possibility of such damages. In no event shall Principled Technologies, Inc.’s liability, including for direct damages, exceed the amounts paid in connection with Principled Technologies, Inc.’s testing. Customer’s sole and exclusive remedies are as set forth herein.
Image close up


