
A Principled Technologies report: Hands-on testing. Real-world results.

Accelerate demanding professional workflows and stay unplugged longer with the HP ZBook 8 G1i
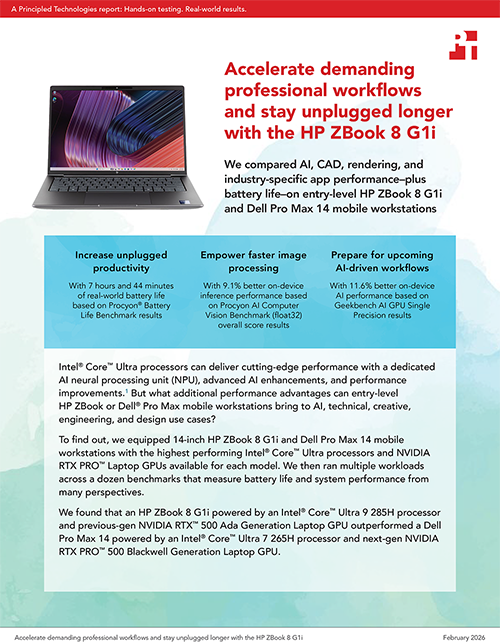
We compared AI, CAD, rendering, and industry-specific app performance–plus battery life–on entry-level HP ZBook 8 G1i and Dell Pro Max 14 mobile workstations
Intel® Core™ Ultra processors can deliver cutting-edge performance with a dedicated AI neural processing unit (NPU), advanced AI enhancements, and performance improvements.1 But what additional performance advantages can entry-level HP ZBook or Dell® Pro Max mobile workstations bring to AI, technical, creative, engineering, and design use cases?
To find out, we equipped 14-inch HP ZBook 8 G1i and Dell Pro Max 14 mobile workstations with the highest performing Intel® Core™ Ultra processors and NVIDIA RTX PRO™ Laptop GPUs available for each model. We then ran multiple workloads across a dozen benchmarks that measure battery life and system performance from many perspectives.
We found that an HP ZBook 8 G1i powered by an Intel® Core™ Ultra 9 285H processor and previous-gen NVIDIA RTX™ 500 Ada Generation Laptop GPU outperformed a Dell Pro Max 14 powered by an Intel® Core™ Ultra 7 265H processor and next-gen NVIDIA RTX PRO™ 500 Blackwell Generation Laptop GPU.
What we tested
We tested HP ZBook 8 G1i and Dell Pro Max 14 mobile workstations, each running Windows 11 Pro and equipped with the highest performing Intel® Core™ Ultra processors and NVIDIA RTX PRO™ Laptop GPUs available for each model, 64 GB of memory, and 1 TB of NVMe® SSD storage:
HP ZBook 8 G1i equipped with an Intel® Core™ Ultra 9 285H processor, previous-gen NVIDIA RTX™ 500 Ada Generation Laptop GPU, 64 GB of DDR5-5600 MT/s memory, a 14-inch LED display with peak resolution of 1,920 x 1,200, and a 77-Whr battery.
Dell Pro Max 14 equipped with an Intel® Core™ Ultra 7 265H processor, next-gen NVIDIA RTX PRO™ 500 Blackwell Generation Laptop GPU, 64 GB of LPCAMM-7500 MT/s memory, a 14-inch LCD display with peak resolution of 1,920 x 1,200, and a 72-Whr battery.
To evaluate their performance under real-world, resource-intensive conditions, we conducted a series of benchmarks covering everyday computing, content creation, AI-driven tasks, and battery life:
- Blender benchmark: We executed three workloads to measure hardware capabilities across multiple 3D rendering scenes.
- Cinebench 2024: We tested CPU single-core performance.
- Geekbench AI: We tested GPU-based AI inference performance.
- Geekbench 6 Pro: We tested CPU-based system performance in multi-threaded applications.
- PassMark PerformanceTest 11: We assessed overall system performance.
- Procyon AI Computer Vision: We evaluated on-device AI inference performance using multiple precision levels and machine learning (ML) models.
- Procyon AI Text Generation: We evaluated on-device small language model (SLM) and large language model (LLM) performance when performing natural language processing (NLP) tasks.
- Procyon Battery Life Benchmark: We measured real-world battery life in a resource-intensive office productivity scenario.
- Puget Bench for Photoshop: We tested real-world content creation performance using this Adobe Creative Cloud application.
- Revit 2024 RFO benchmark: We tested several tasks using the app Autodesk® Revit.
- SPECapc® for Creo 9: We tested real-world GPU performance using this CAD application.
- SPECapc® for SolidWorks® 2024: We tested real-world rendering performance using this CAD application.
- SPECworkstation™ 4.0: We evaluated AI acceleration, CPU, graphics, and storage performance through the lens of several industry-specific workflows.
- Topaz Video AI: We executed 2x and 4x video upscaling tasks and frame interpolation at Full HD (FHD) and 4K resolutions using multiple AI models
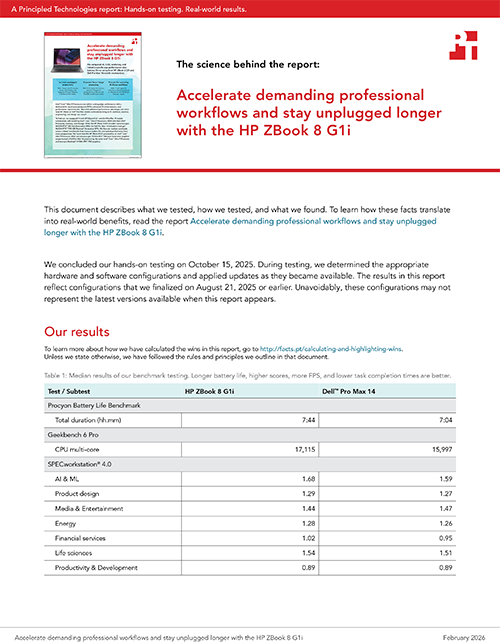
Note: The graphs in this report use different scales to keep a consistent size. Please be mindful of each graph’s data range as you compare.
Increase unplugged productivity
With more unplugged time at your fingertips, you can work confidently without being tethered to an outlet. To determine real-world battery life in resource-intensive situations, we ran the Office Productivity workload in the Procyon Battery Life Benchmark. This simulates the mixed workloads an average enterprise user would perform with resource-intensive Microsoft 365 applications throughout the day.4
We found that the larger 77-Whr battery in the HP ZBook 8 G1i delivered 40 additional minutes of unplugged power compared to the 72-Whr battery in the Dell Pro Max 14, letting you choose the best seat at the table without battery anxiety.

Take specialized team productivity to new heights
Users tax their workstations in different ways. But whether you’re creating and editing 2D drawings, rendering charts and graphs, or exploring a new AI initiative, you need a system that can keep up with your workflow. The less time you spend waiting, the faster your projects can move.
The Geekbench 6 Pro benchmark measures CPU and GPU performance in real-world scenarios, using workloads that range from image processing and file compression to ML and ray tracing.5 If a system delivers a higher Geekbench 6 Pro CPU multi-core score, you can expect smoother multitasking and faster performance for multi-threaded apps.

We also ran the SPECworkstation 4.0 benchmark, which measures a system’s performance across a range of workloads representing different industries, including life sciences, energy, design, and financial services. If you work in one of these industries, you’ll want to take a close look: Higher scores can mean faster execution of tasks and an increase in productive work.

Accelerate your data visualization efforts
According to neuroscience studies, the human brain is better at interpreting images, colors, patterns, and motion over text content, with memory retention of visual content at 80 percent versus 20 percent for text content.6 And, with approximately 65 percent of people describing themselves as visual learners, content with meaningful graphics is a must for every industry.7
The Cinebench 2024 benchmark utilizes the Redshift rendering engine in Cinema 4D and a complex 3D scene to tax hardware capabilities.8 A higher Cinebench 2024 single-core score translates to improved rendering of complex visuals—think detailed charts, vector graphics, or interactive dashboards.

The PassMark PerformanceTest 11 benchmark provides a comprehensive assessment of system performance measuring CPU, 2D and 3D graphics, disk speed, and memory capabilities to deliver an overall performance rating.9 A higher overall PassMark rating indicates better multitasking capabilities for users running multiple visualization tools alongside other applications.

Get AI-assisted insights faster
If you’re buying a mobile workstation today, it’s vital to choose a system that can deliver strong performance for local AI workloads. Online AI tools are valuable, but by running AI workloads locally, you can gain real-time insights and generate engaging content while maintaining total control over your private data. Better performance for AI workloads can also make for a better user experience when you’re interacting with AI-assisted applications, which includes more apps every day. This can be a boon for everyone, from engineers to software developers to graphic designers and artists.
The Geekbench AI benchmark measures real-world performance for AI and ML workloads. Geekbench AI offers three distinct scores, because as they explain, “AI workloads cover a range of precision levels, depending on the task needed, the hardware available, and the frameworks in between.”10 Those scores cover three different precision levels:
- Single precision (float32) prioritizes precision over speed.
- Half precision (float16) balances speed and precision.
- Quantized (int8) prioritizes speed over precision.
While the Dell Pro Max 14 pulled ahead by 2 percent in our Half Precision testing, the HP ZBook 8 G1i was decidedly stronger on both Single Precision and Quantized testing, indicating overall stronger performance for AI/ML tasks.

For another angle on AI performance, we stressed the systems with the Procyon AI Computer Vision Benchmark.11 Here, again, we tested with different precision levels—float32 to prioritize accuracy, float16 to prioritize speed, and Int8 to maximize speed with lower precision—so you can reference the score that matches the precision level you need.

Finally, we explored the systems’ performance for LLMs using the Procyon AI Text Generation benchmark, which offers “a more compact and easier way to repeatedly and consistently test AI performance with multiple LLM models.”12 We tested with four different models:
- Llama 2: This LLM, which automates NLP tasks, is helpful for handling queries across different languages in basic chatbot scenarios.13
- Llama 3: Taking NLP task automation a step further, this LLM brings improved reasoning, summarization, and translation capabilities.14
- Mistral: Companies including banks, insurance companies, and e-commerce stores use this LLM to automate business processes, customer support, and content generation.15
- Phi-3.5: This SLM is valuable for generative AI applications, powering virtual assistants, AI agents, chatbots, and on-device AI.16

Push projects out the door faster
If complex graphics and 3D models are an integral part of your job, getting the most performance from your workstation is especially critical. There’s nothing more frustrating than pressing the render button and waiting long minutes—or hours—to see the file, only to realize you made a small mistake and have to start all over again. All that waiting is unproductive, especially if the system slows down all your other apps while the render is occurring.
With a responsive workstation that can make graphics smoother and faster, you can get a lot more done in a day.
Render your ideas into reality with fewer roadblocks
The Blender benchmark measures how quickly a system can render path-tracing samples, a type of rendering that has to do with how light impacts objects in a 3D render.17 We tested with three real-world models—Classroom, The Junk Shop, and Monster—each stressing the hardware in slightly different ways and therefore offering a different perspective on performance.

For teams that rely on Adobe® Creative Suite applications, Puget Bench for Photoshop uses Adobe Photoshop™ to measure a system’s photo-editing performance, which largely stresses the CPU and GPU.18 It delivers a score based on how long it takes to complete general and filter tests, results that can translate directly to real-world Photoshop use.

Video editors and creators may be interested in our results from the Topaz Labs Video AI benchmark. Topaz Video is AI-powered video enhancement software, ideal for “upscaling old or low-resolution video to 4K+, reducing noise and blur, deinterlacing, restoring archival footage, and creating smooth slow motion.”19 The benchmark assesses AI-powered video-editing performance by testing video upscaling (to 1x, 2x, and 4x) at FHD and 4K resolutions and reporting how many frames per second the system can process.20 Higher scores on this benchmark indicate more raw video AI processing speed, which can help you finish video projects faster. While we’ve highlighted key wins in Figure 11, the HP ZBook 8 G1i also delivered equivalent or better performance than the Dell Pro Max 14 in a number of other Topaz Video AI tests. You can see those results in the science behind the report.

Complete critical 3D models faster
Revit, a leading building information modeling software, is critical for the architects, construction teams, and engineers designing tomorrow’s infrastructure. To speak to the needs of these teams, we used the Revit 2024 RFO benchmark, which measures model creation, rendering, exporting, and graphics performance when using Autodesk Revit 2024.21 The HP ZBook 8 G1i delivered faster performance on multiple Revit tasks, including creating a model and transitioning between view styles.


Lastly, we ran two application-specific benchmarks: SPECapc for Creo 9 and SPECapc for SolidWorks. Both Creo and SolidWorks are 3D computer-aided design (CAD) applications that empower designers and engineers to build realistic 3D models of products. Each application has its own advantages, so we wanted to test with both benchmarks to assess performance for teams that rely on Creo and those that use SolidWorks. The HP ZBook 8G1i offered stronger performance regardless of application.


Conclusion
Heavy applications place a premium on workstation performance. We proved that the HP ZBook 8 G1i can deliver. Compared to a Dell Pro Max 14, the HP ZBook 8 G1i offered small but consistent improvements across a wide range of areas, from GenAI applications to 3D workflows to battery life. For professionals whose days include AI inference, content creation, or CAD/3D modeling, our testing indicates that the HP ZBook 8 G1i is a strong choice compared to the Dell Pro Max 14 we tested.

 Twitter
 Facebook
 LinkedIn
 Email
Email- Intel press release, “Intel Expands Leadership in AI PCs and Edge Computing at CES 2025,” accessed December 18, 2025, https://www.intc.com/news-events/press-releases/detail/1722/intel-extends-leadership-in-ai-pcs-and-edge-computing-at.
- HP, “HP ZBook 8 G1i,” accessed December 15, 2025, https://www.hp.com/us-en/workstations/zbook-8.html.
- Intel, “Intel Core Ultra 9 Processor 285H,” accessed December 15, 2025, https://www.intel.com/content/www/us/en/products/sku/241747/intel-core-ultra-9-processor-285h-24m-cache-up-to-5-40-ghz/specifications.html.
- UL Solutions, “Procyon® Battery Life Benchmark,” accessed December 18, 2025, https://benchmarks.ul.com/procyon/battery-life-benchmark.
- Geekbench, “Geekbench 6 Benchmark Internals, “ accessed December 15, 2025, https://www.geekbench.com/doc/geekbench6-benchmark-internals.pdf.
- Florence, “10 Neuroscience-Based Statistics That Prove Visual SOPs Are More Effective Than Written Procedures,” accessed January 8, 2026, https://speach.me/blog/10-neuroscience-based-statistics-that-prove-visual-sops-are-more-effective-than-written-procedures.
- Bernhard Schroeder, “Industry Studies Abd Insights On Why You Need To Choose Better Photos For Your Marketing Efforts,” accessed January 8. 2026, https://www.forbes.com/sites/bernhardschroeder/2022/10/12/industry-studies-and-insights-on-why-you-need-to-choose-better-photos-for-your-marketing-efforts/.
- Maxon, “Cinebench 2024 – A Developer’s Vision Realized,” accessed January 8, 2026, https://www.maxon.net/en/article/cinebench-2024-a-developers-vision-realized?srsltid=AfmBOopKuCAkomSq793G5WlMKAcZvOwAkmWsChEcinFz0IwYN4451AjO.<
- PassMark Software, “PerformanceTest,” accessed January 8, 2026, https://www.passmark.com/products/performancetest/?srsltid=AfmBOoqxAMXpapJioSfr1LzT9yVwYk_qNrz6_7vYCTaq6v6eNtvCmJ1R.
- John Poole, “Geekbench AI 1.0,” accessed December 15, 2025, https://www.geekbench.com/blog/2024/08/geekbench-ai/.
- UL Solutions, “Benchmark tests,” accessed December 21, 2025, https://support.benchmarks.ul.com/support/solutions/articles/44002386124-benchmark-tests.
- UL Solutions, “Procyon® AI Text Generation Benchmark,” accessed December 15, 2025, https://benchmarks.ul.com/procyon/ai-text-generation-benchmark.
- Kanerika, “Llama 3 vs Llama 2 in 2025 – Use-case Guide & Decision Framework,” accessed December 18, 2025, https://kanerika.com/blogs/llama-3-vs-llama-2/.
- Kanerika, “Llama 3 vs Llama 2 in 2025 – Use-case Guide & Decision Framework”.
- Latenode, “What is Mistral 7B and How Can It Supercharge Your Business Processes?” accessed December 18, 2025, https://latenode.com/blog/ai-technology-language-models/mistral-ai/what-is-mistral-7b-and-how-can-it-supercharge-your-business-processes.
- Carl Franzen, “Microsoft releases powerful new Phi-3.5 models, beating Google, OpenAI, and more,” accessed December 18, 2025, https://venturebeat.com/ai/microsoft-releases-powerful-new-phi-3-5-models-beating-google-openai-and-more.
- Blender, “Sampling,” accessed December 21, 2025, https://docs.blender.org/manual/en/latest/render/cycles/render_settings/sampling.html.
- Puget Systems, “Puget Bench for Photoshop,” accessed December 18, 2025, https://www.pugetsystems.com/pugetbench/creators/photoshop/.
- Topaz Labs, “Topaz Video,” accessed December 15, 2025, https://www.topazlabs.com/topaz-video.
- Topaz Labs, “Benchmark vs real performance,” accessed December 15, 2025, https://community.topazlabs.com/t/benchmark-vs-real-performance/51554.
- Autodesk, “What graphics card will provide the best performance in Revit?” accessed December 18, 2025, https://www.autodesk.com/support/technical/article/caas/sfdcarticles/sfdcarticles/Revit-What-Graphics-card-will-give-the-best-performance.html.
This project was commissioned by HP.
February 2026
Principled Technologies is a registered trademark of Principled Technologies, Inc.
All other product names are the trademarks of their respective owners.
Principled Technologies disclaimer
Principled Technologies is a registered trademark of Principled Technologies, Inc.
All other product names are the trademarks of their respective owners.
DISCLAIMER OF WARRANTIES; LIMITATION OF LIABILITY:
Principled Technologies, Inc. has made reasonable efforts to ensure the accuracy and validity of its testing, however, Principled Technologies, Inc. specifically disclaims any warranty, expressed or implied, relating to the test results and analysis, their accuracy, completeness or quality, including any implied warranty of fitness for any particular purpose. All persons or entities relying on the results of any testing do so at their own risk, and agree that Principled Technologies, Inc., its employees and its subcontractors shall have no liability whatsoever from any claim of loss or damage on account of any alleged error or defect in any testing procedure or result.
In no event shall Principled Technologies, Inc. be liable for indirect, special, incidental, or consequential damages in connection with its testing, even if advised of the possibility of such damages. In no event shall Principled Technologies, Inc.’s liability, including for direct damages, exceed the amounts paid in connection with Principled Technologies, Inc.’s testing. Customer’s sole and exclusive remedies are as set forth herein.
Image close up


