
A Principled Technologies report: Hands-on testing. Real-world results.

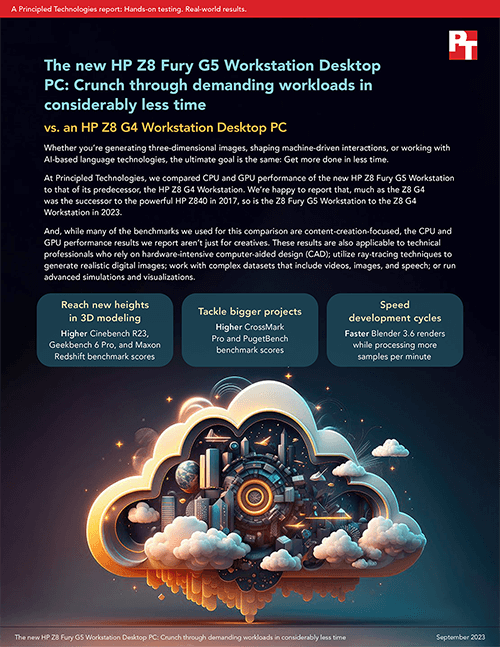
The new HP Z8 Fury G5 Workstation Desktop PC: Crunch through demanding workloads in considerably less time
vs. an HP Z8 G4 Workstation Desktop PC
Whether you’re generating three-dimensional images, shaping machine-driven interactions, or working with AI-based language technologies, the ultimate goal is the same: Get more done in less time.
At Principled Technologies, we compared CPU and GPU performance of the new HP Z8 Fury G5 Workstation to that of its predecessor, the HP Z8 G4 Workstation. We’re happy to report that, much as the Z8 G4 was the successor to the powerful HP Z840 in 2017, so is the Z8 Fury G5 Workstation to the Z8 G4 Workstation in 2023.
And, while many of the benchmarks we used for this comparison are content-creation-focused, the CPU and GPU performance results we report aren’t just for creatives. These results are also applicable to technical professionals who rely on hardware-intensive computer-aided design (CAD); utilize ray-tracing techniques to generate realistic digital images; work with complex datasets that include videos, images, and speech; or run advanced simulations and visualizations.

How we tested
Before we started testing, we set the G4 workstation power mode to “high performance” and the G5 workstation power mode to “ultimate performance.” Other than making and verifying those changes, we used out-of-box OEM performance settings. To see how much the increased CPU and GPU capabilities on the G5 boosted performance, we tested the best configurations available for each generation:
HP Z8 Fury G5 Workstation
1x 56-core Intel® Xeon® w9-3495X CPU (1.9 - 4.8 GHz)
4x dual-slot NVIDIA® RTX™ 6000 Ada-generation GPUs
8x 16GB cards of DDR5-4800 memory
4x 1TB NVMe® SSDs
HP Z8 G4 Workstation
2x (28-core) Intel Xeon Gold 6258R CPUs (2.7 - 4.0 GHz)
2x NVIDIA RTX A6000 GPUs
12x 8GB cards of DDR5-2933 memory
1TB NVMe SSDs
CPU performance can sometimes limit performance for certain demanding applications. So, we chose punishing CPU- and GPU-intensive workloads that stressed each system in different ways. We ran a range of workloads three times and report the median results:
- Cinebench R23 and Geekbench 6 Pro to compare CPU single- and multi-core performance.
- Geekbench 6 Pro to compare GPU performance with augmented reality and machine learning workloads.
- Blender to compare GPU rendering, multi-GPU acceleration, and ray-tracing performance.
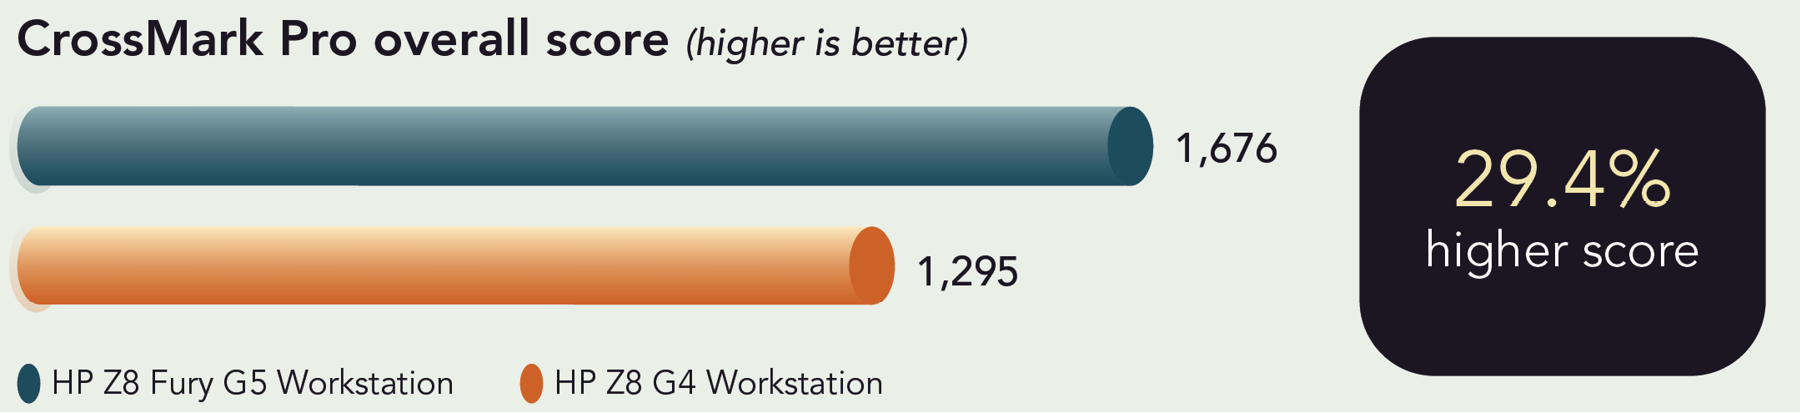
- CrossMark™ Pro to compare general performance in the areas of productivity, creativity, and responsiveness.
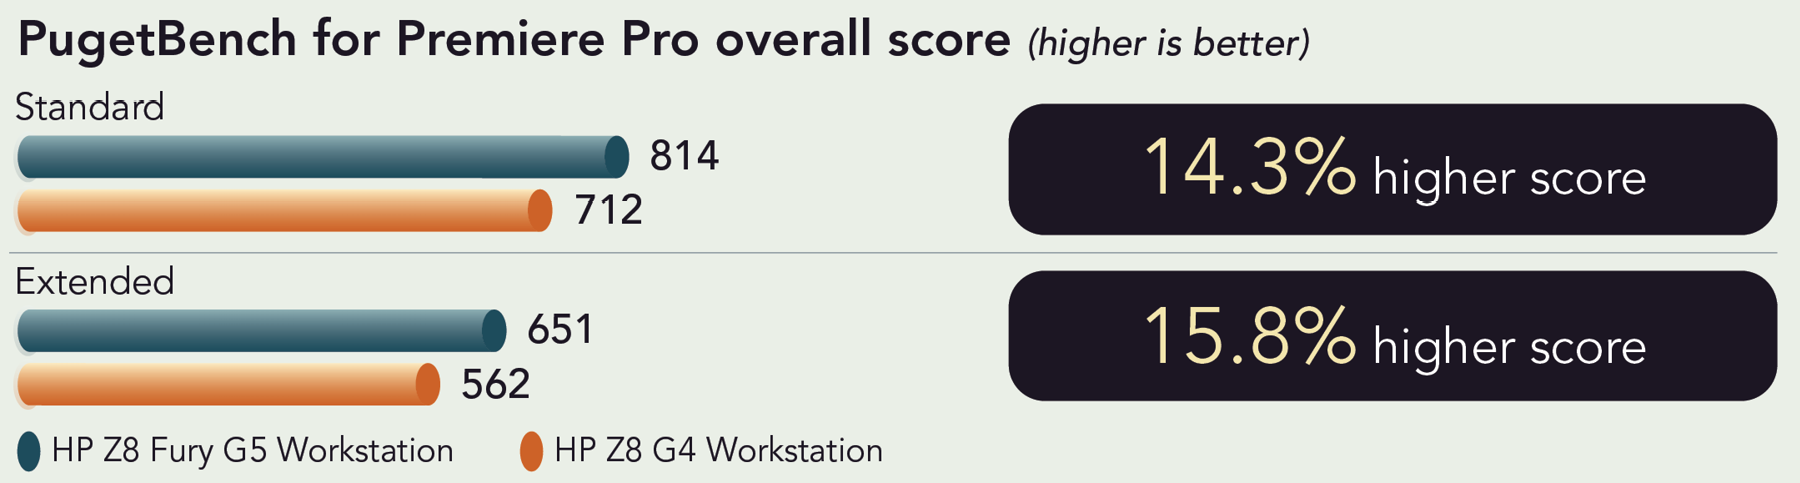
- PugetBench benchmarks to compare photo- and video-editing performance with Adobe® Creative Cloud® apps.
- Maxon Redshift to compare production rendering performance.
The benchmark scores we report reflect the specific configurations we tested. Any difference in the configurations you test, as well as network traffic, or software additions, can affect these results. For a deeper dive into our testing parameters and procedures, see the science behind the report.

Note: The graphs in this report use two different x-axis scales to keep to a consistent size. Please be mindful of each graph’s data range as you compare.
Stay ahead in your industry
With more than 75 percent of businesses looking to embrace big data solutions, take advantage of cloud computing technologies, and profit from AI in the next five years, powerful workstations are more important than ever.3 High-performance workstations are useful for everything from AI and machine learning engineering to resource exploration models; from architectural design to data science research; and from building virtual worlds to utilizing deep learning algorithms.
From AI creation to resource exploration models
The Cinebench benchmark provides performance scores based on “Cinema 4D’s ability to take advantage of multiple CPU cores and modern processor features available to the average user.”4 Cinema 4D is real-world 3D computer animation, modeling, simulation, and rendering software.5
Higher CPU single- and multi-core scores in our Cinebench R23 and Geekbench 6 Pro comparisons highlight the advantages the single-socket, 56-core Intel Xeon w9-3495X processor brought to the table. This jump forward can be a boon for engineers and data scientists trying to complete difficult and resource-heavy machine learning tasks as quickly as possible.


From architectural design to data science research
To measure performance in cutting-edge areas such as augmented reality and machine learning, the Geekbench 6 Pro GPU Compute benchmarks use popular, real-world applications and claim to use realistic data sets.6
The HP Z8 Fury G5 Workstation received higher scores in all three Geekbench 6 Pro comparisons we ran. In particular, the higher GPU Compute OpenCL score highlights how well the HP Z8 Fury G5 Workstation handled computational tasks such as identifying objects, blurring backgrounds, running a particle physics simulation, and synthesizing images.7


From building virtual worlds to deep learning
While you may not utilize Blender or Adobe Creative Cloud applications every day, these intensive graphic sprints provide you with a snapshot of how much better the HP Z8 Fury G5 Workstation handles resource-intensive applications and complex workflows than its G4 predecessor. This improvement is due in large part to the single 56-core Intel Xeon w9-3495X processor and four NVIDIA RTX 6000 graphics cards.
We chose content creation workloads that stressed the workstations in a variety of ways. This provides you with a more complete picture of the two systems’ capabilities.
3D rendering tasks
In 3D rendering, a higher number of samples translates to a cleaner picture—but the trade-off is typically longer rendering times. In both the Maxon Redshift and Blender 3.6 GPU rendering benchmark comparisons, the HP Z8 Fury G5 Workstation Desktop PC blew past that potential bottleneck.


Content creation tasks
People in many industries use Adobe Creative Cloud applications. The HP Z8 Fury G5 Workstation outperformed its predecessor in an array of Adobe Creative Cloud comparisons.


General productivity tasks
On the surface, the CrossMark Pro benchmark measures common user performance and responsiveness by modeling real-world applications—however, it goes deeper than that. The CrossMark Pro benchmark also “scales similarly to real applications across CPU frequency, cores and threads, system memory, storage, GPU, and other capabilities.”8 This scalability aspect gives creative and technical professionals a better idea of how the systems we tested can handle increasingly complex day-to-day activities. The benchmark itself contains sub-scenarios that model multi-tasking, email creation/management, document/photo/video editing, scientific simulations, forecasting spreadsheets, and web browsing capabilities.9
Conclusion
Powerful workstations are more important than ever for companies preparing for the future by embracing big data solutions, leveraging cloud computing technologies, and training or processing algorithms. Our content creation benchmark results show that creative and technical professionals can get more done in less time by upgrading to the new HP Z8 Fury G5 Workstation.
 Twitter
 Facebook
 LinkedIn
 Email
Email- HP, “HP Z8 Fury,“ accessed August 22, 2023, https://www.hp.com/us-en/workstations/z8-fury.html.
- HP, “HP Anyware Remote System Controller,” accessed August 22, 2023, https://www.hp.com/us-en/solutions/anyware-remote-system-controller.html.
- World Economic Forum, “Future of Jobs Report 2023,” accessed July 31, 2023, https://www3.weforum.org/docs/WEF_Future_of_Jobs_2023.pdf.
- Maxon, “Cinebench,” accessed August 22, 2023, https://www.maxon.net/en/cinebench.
- Maxon, “Cinema 4D,” accessed August 22, 203, https://www.maxon.net/en/cinema-4d.
- Geekbench, “Introducing Geekbench 6,” accessed August 22, 2023, https://www.geekbench.com.
- Geekbench, “Geekbench 6 GPU Compute Workloads,” accessed August 23, 2023, https://www.geekbench.com/doc/geekbench6-gpu-compute-workloads.pdf.
- BAPCo, “CrossMark™,” accessed August 23, 2023, https://bapco.com/wp-content/uploads/2021/04/crossmark_white_paper_v1.0.pdf.
- BAPCo, “CrossMark.”
- Intel, “Intel Launches new Xeon Workstation Processors—the Ultimate Solution for Professionals,” accessed August 22, 2023, https://www.intel.com/content/www/us/en/newsroom/news/intel-launches-new-xeon-workstation-processors.html#gs.4quj4k.
This project was commissioned by HP.
September 2023
Principled Technologies is a registered trademark of Principled Technologies, Inc.
All other product names are the trademarks of their respective owners.
Principled Technologies disclaimer
Principled Technologies is a registered trademark of Principled Technologies, Inc.
All other product names are the trademarks of their respective owners.
DISCLAIMER OF WARRANTIES; LIMITATION OF LIABILITY:
Principled Technologies, Inc. has made reasonable efforts to ensure the accuracy and validity of its testing, however, Principled Technologies, Inc. specifically disclaims any warranty, expressed or implied, relating to the test results and analysis, their accuracy, completeness or quality, including any implied warranty of fitness for any particular purpose. All persons or entities relying on the results of any testing do so at their own risk, and agree that Principled Technologies, Inc., its employees and its subcontractors shall have no liability whatsoever from any claim of loss or damage on account of any alleged error or defect in any testing procedure or result.
In no event shall Principled Technologies, Inc. be liable for indirect, special, incidental, or consequential damages in connection with its testing, even if advised of the possibility of such damages. In no event shall Principled Technologies, Inc.’s liability, including for direct damages, exceed the amounts paid in connection with Principled Technologies, Inc.’s testing. Customer’s sole and exclusive remedies are as set forth herein.
Image close up


