A Principled Technologies report: Hands-on testing. Real-world results.
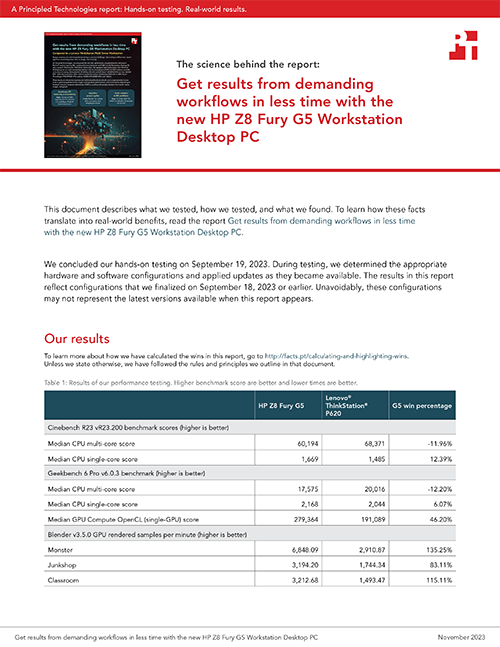
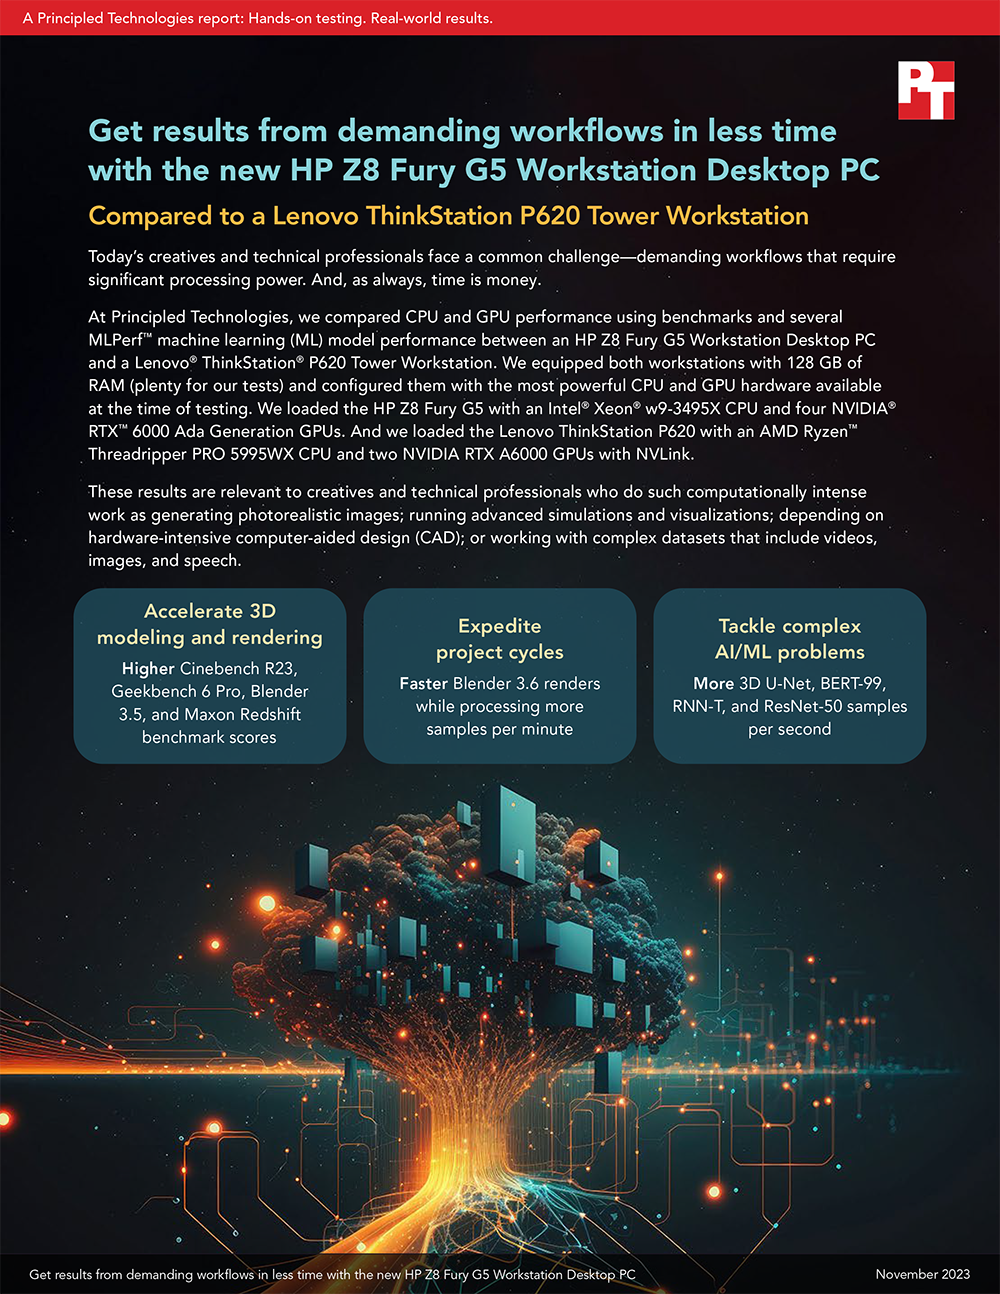
Get results from demanding workflows in less time with the new HP Z8 Fury G5 Workstation Desktop PC
Compared to a Lenovo ThinkStation P620 Tower Workstation
Today’s creatives and technical professionals face a common challenge—demanding workflows that require significant processing power. And, as always, time is money.
At Principled Technologies, we compared CPU and GPU performance using benchmarks and several MLPerf™ machine learning (ML) model performance between an HP Z8 Fury G5 Workstation Desktop PC and a Lenovo® ThinkStation® P620 Tower Workstation. We equipped both workstations with 128 GB of RAM (plenty for our tests) and configured them with the most powerful CPU and GPU hardware available at the time of testing. We loaded the HP Z8 Fury G5 with an Intel® Xeon® w9-3495X CPU and four NVIDIA® RTX™ 6000 Ada Generation GPUs. And we loaded the Lenovo ThinkStation P620 with an AMD Ryzen™ Threadripper PRO 5995WX CPU and two NVIDIA RTX A6000 GPUs with NVLink.
These results are relevant to creatives and technical professionals who do such computationally intense work as generating photorealistic images; running advanced simulations and visualizations; depending on hardware-intensive computer-aided design (CAD); or working with complex datasets that include videos, images, and speech.
How we tested
Before we started testing, we set the Lenovo workstation power mode to “high performance” and the HP workstation power mode to “ultimate performance.” Other than those changes, we used out-of-box OEM performance settings. We tested the highest performance CPU and GPU configurations available for each workstation:
HP Z8 Fury G5 Workstation Desktop PC*
1x 56-core Intel Xeon w9-3495X CPU (1.9 - 4.8 GHz)
4x NVIDIA RTX 6000 Ada Generation GPUs
48GB VRAM per GPU
128GB DDR5-4800 memory
4x 1TB PCIe® storage
Lenovo ThinkStation P620 Tower Workstation*
1x 64-core AMD Ryzen Threadripper PRO 5995WX CPU (2.7 - 4.5 GHz)
2x NVIDIA RTX A6000 GPUs with NVLink
2x 48GB VRAM combined via NVLink high-speed interconnect
128GB DDR5-3200 memory
1TB PCIe storage
*A note on GPU and storage discrepancies: We could only have configured the Lenovo ThinkStation P620 with either two RTX A6000 GPUs with NVLink or a single RTX 6000 Ada—there were no other configuration options for top-performing cards. Although the Lenovo ThinkStation had only two GPUs, those two RTX A6000 GPUs also had an NVLink. NVLink is a high-speed processor interconnect that enabled the two RTX A6000 processors to “send and receive data from shared pools of memory at lightning speed,”1 which effectively doubles the amount of memory available to benchmarks that have large datasets. This configuration gave the Lenovo an advantage versus using a single RTX 6000 Ada. As for the storage discrepancy, our benchmark tests taxed each system’s primary 1TB high-performance PCIe storage, but we did not run any tests that we believe storage capacity would affect.
About the HP Z8 Fury G5
According to HP, the HP Z8 Fury G5 Workstation contains “transformative” single-socket Intel Xeon w9 processor technology with up to 56 cores, 1.5 TB of high-speed memory, up to 56 TB of storage, ISV certification for professional apps, and four NVIDIA RTX 6000 Ada-generation GPUs. This combination enables users to tackle the most complex simulations, virtual production, and high-quality VFX projects.2
While we didn’t test internal or external security features on this model, the rack-mountable HP Z8 Fury G5 Workstation includes lockable front access carriers, side panel locks with an interlock sensor, and a Kensington lock slot to prevent the physical removal of the workstation. Plus, HP Anyware Remote System Controller allows your designated IT team to remotely manage your workstation fleet from a single interface.3
Because application performance can be limited by processor speeds, we chose punishing CPU- and GPU-intensive content creation benchmarks that stressed each workstation in different ways:
Blender to compare GPU rendering, multi-GPU acceleration, and ray-tracing performance
Cinebench R23 and Geekbench 6 Pro to compare CPU single-core performance
Geekbench 6 Pro to compare GPU performance with augmented reality (AR) and ML workloads
Maxon Redshift to compare production rendering performance
PugetBench for Lightroom Classic to compare photo-editing performance with the Adobe® Lightroom® Classic app
We also ran the following MLPerf Inference Benchmark Suite ML models in the offline scenario mode, where the workstations can process the data in any order, without latency constraints.4 These results enable readers to compare inference performance from multiple angles:
3D U-Net to compare medical imaging and 3D image segmentation performance
BERT-99 to compare natural language processing performance
ResNet-50 to compare image classification and detection performance
RNN-T to compare speech recognition performance
We ran each test three times and report the median results. The benchmark scores and ML results we report reflect the specific configurations we tested. Any difference in the configurations you test, as well as network traffic or software additions, could generate results. For a deeper dive into our testing parameters and procedures, see the science behind the report.
Note: The graphs in this report use different x-axis scales to keep to a consistent size. Please be mindful of each graph’s data range as you compare.
Deliver measurable value to your business
The World Economic Forum says that, in the next five years, over 75 percent of businesses are planning to adopt big data solutions, make use of cloud computing technologies, and capitalize on AI. These goals make high-performance workstations a serious contender for many creative and professional endeavors.5
Accelerate 3D modeling and rendering
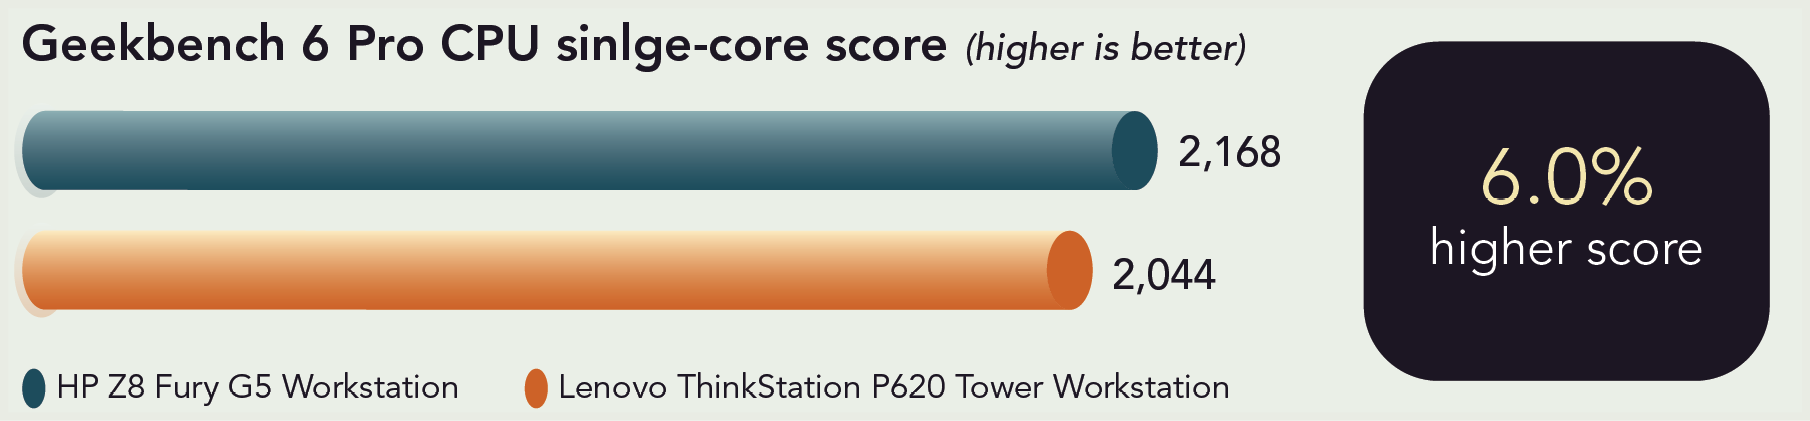
The Cinebench benchmark provides performance scores based on “Cinema 4D’s ability to take advantage of multiple CPU cores and modern processor features available to the average user.”6 Cinema 4D is real-world 3D computer animation, modeling, simulation, and rendering software.7 The Geekbench 6 Pro benchmark uses popular, real-world applications and realistic data sets to evaluate performance in cutting-edge areas such as AR and ML.8
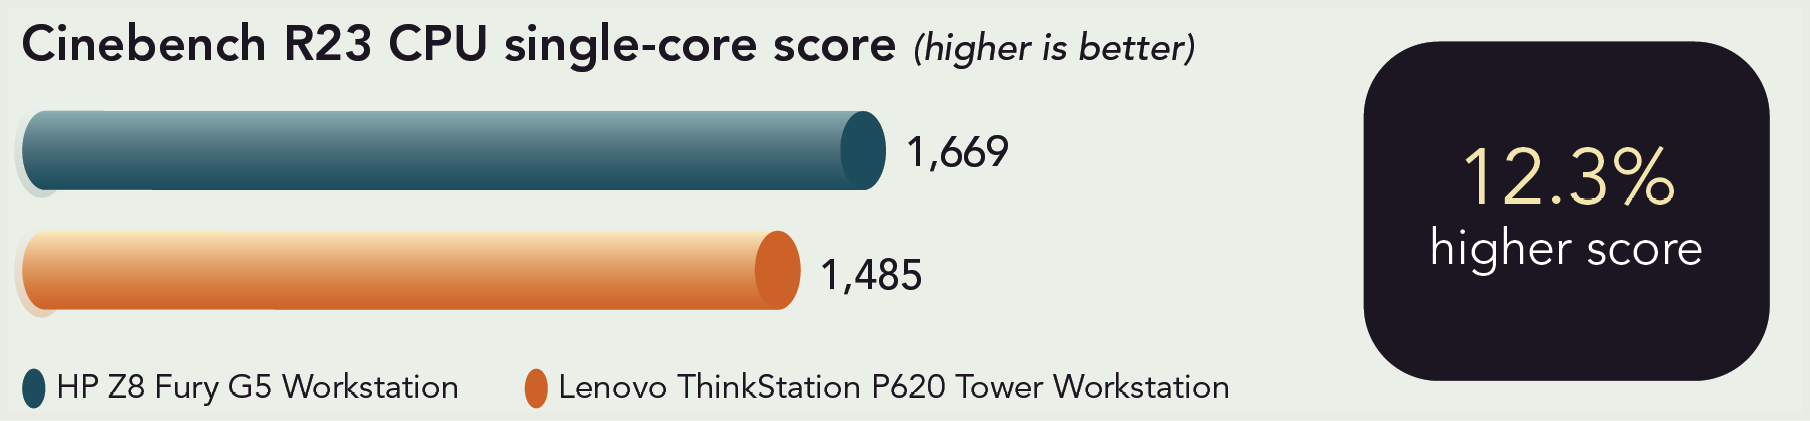
Higher CPU single-score scores in our Cinebench R23 and Geekbench 6 Pro comparisons accentuate the advantages the Intel Xeon w9-3495X processor-powered system brings to the table.
Cinebench R23 CPU single-core scores. Higher is better. Source: Principled Technologies.
Geekbench 6 Pro CPU single-core scores. Higher is better. Source: Principled Technologies.
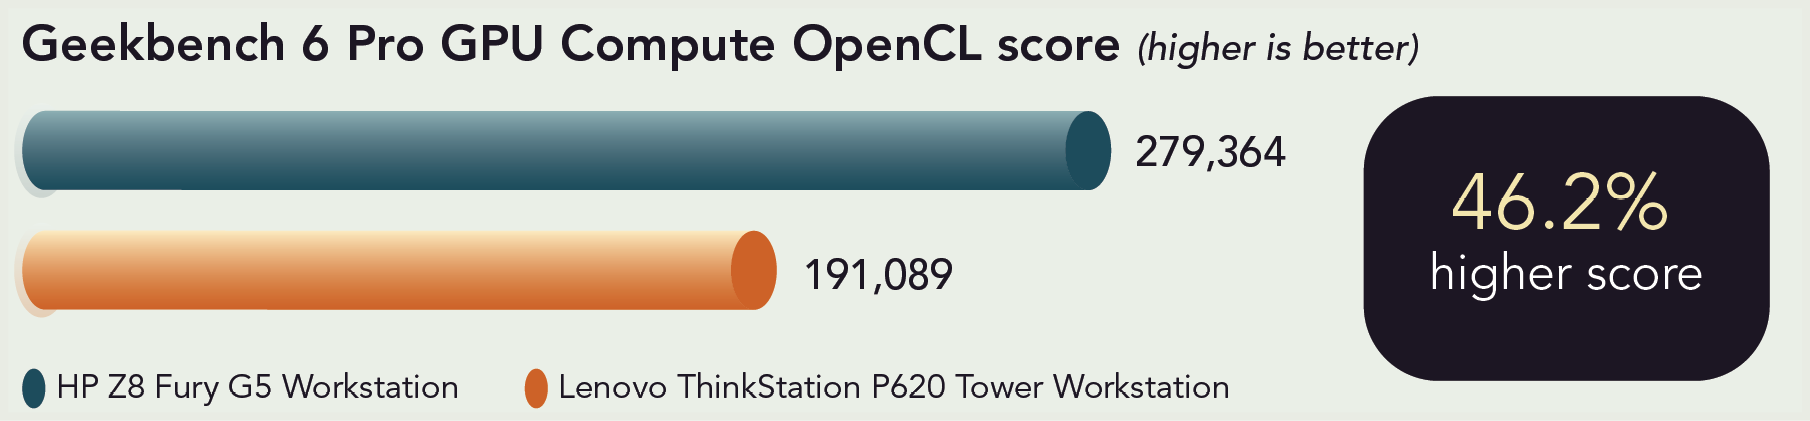
The higher GPU Compute score in our Geekbench 6 Pro comparison shows how much better the HP Z8 Fury G5 Workstation could handle computational tasks such as identifying objects, blurring backgrounds, running a particle physics simulation, and image synthesis.9
Geekbench 6 Pro GPU Compute scores. Higher is better. Source: Principled Technologies.
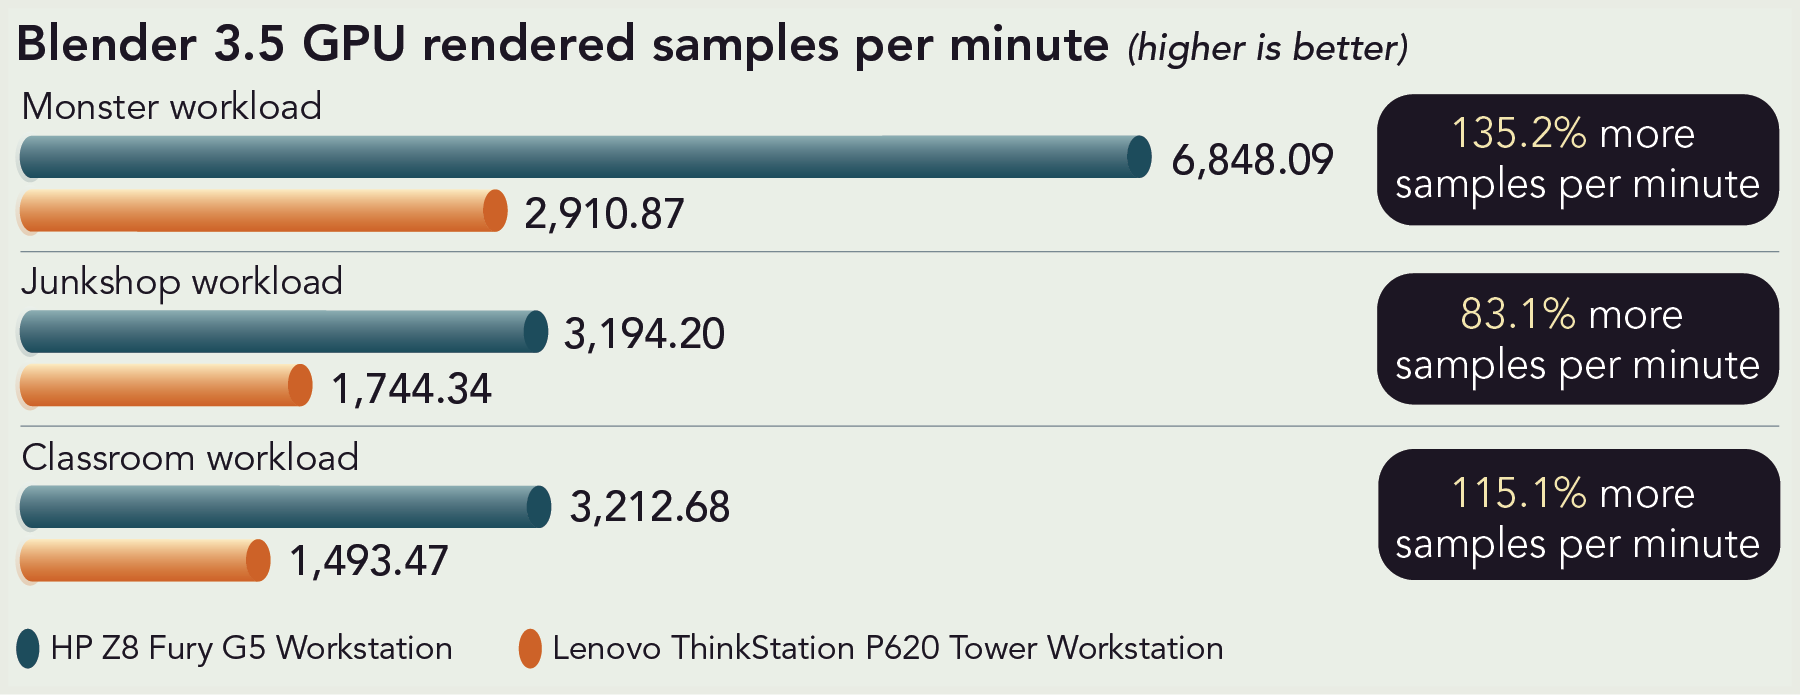
The following Blender 3.5 and Maxon Redshift benchmarks provide a snapshot of how much better the HP Z8 Fury G5 with its 56-core Intel Xeon w9-3495X CPU and four NVIDIA RTX 6000 GPUs could handle resource-intensive applications and complex workflows compared to the Lenovo ThinkStation P620 with its 64-core AMD Ryzen Threadripper PRO 5995WX CPU and two NVIDIA RTX A6000 GPUs with NVLink.
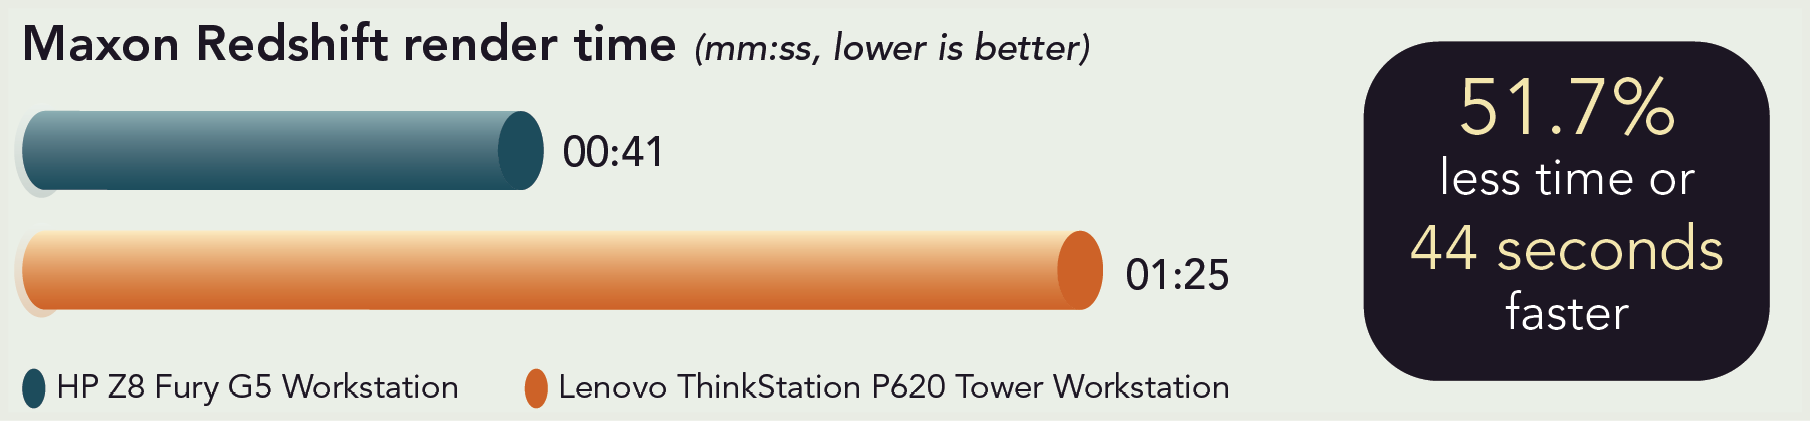
A higher number of samples translates to a cleaner picture—but the compromise is often longer render times. In both the Blender 3.5 and Maxon Redshift GPU rendering benchmark comparisons, the HP Z8 Fury G5 Workstation Desktop PC blows past that possible bottleneck.
Blender 3.5 samples per minute. Higher is better. Source: Principled Technologies.
Maxon Redshift render times. Lower is better. Source: Principled Technologies.
Expedite project cycles
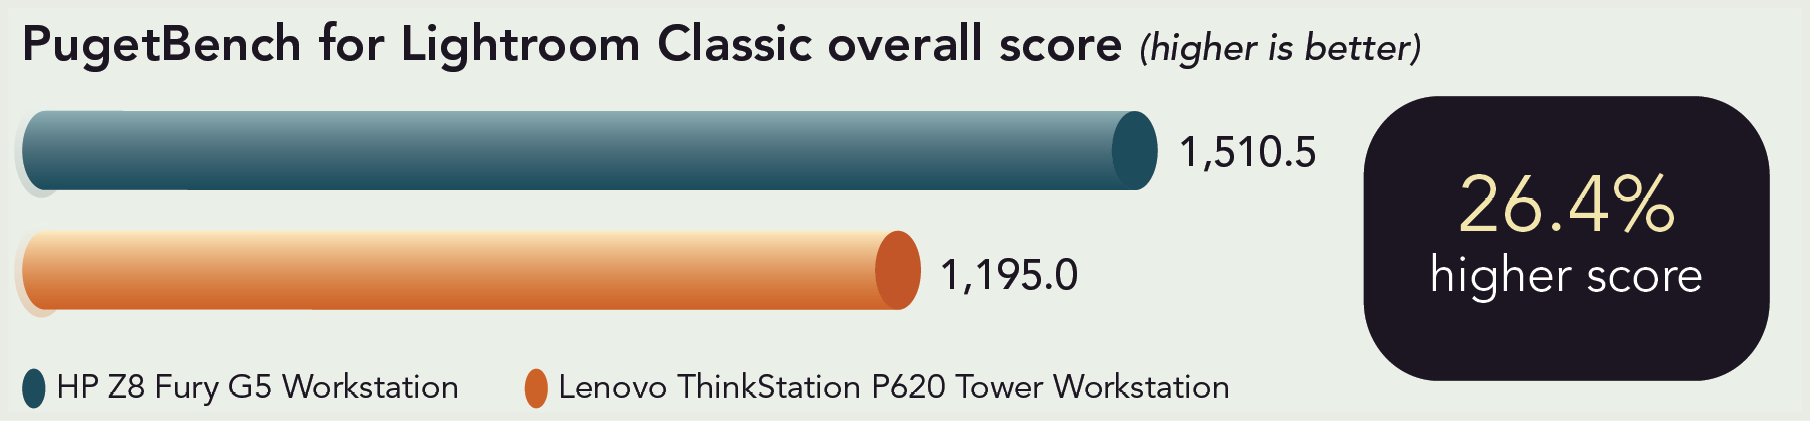
The faster professional photographers and graphic designers can complete tasks with Adobe® Creative Cloud® applications, the easier it can be to meet deadlines.
PugetBench for Adobe Lightroom Classic overall scores. Higher is better. Source: Principled Technologies.
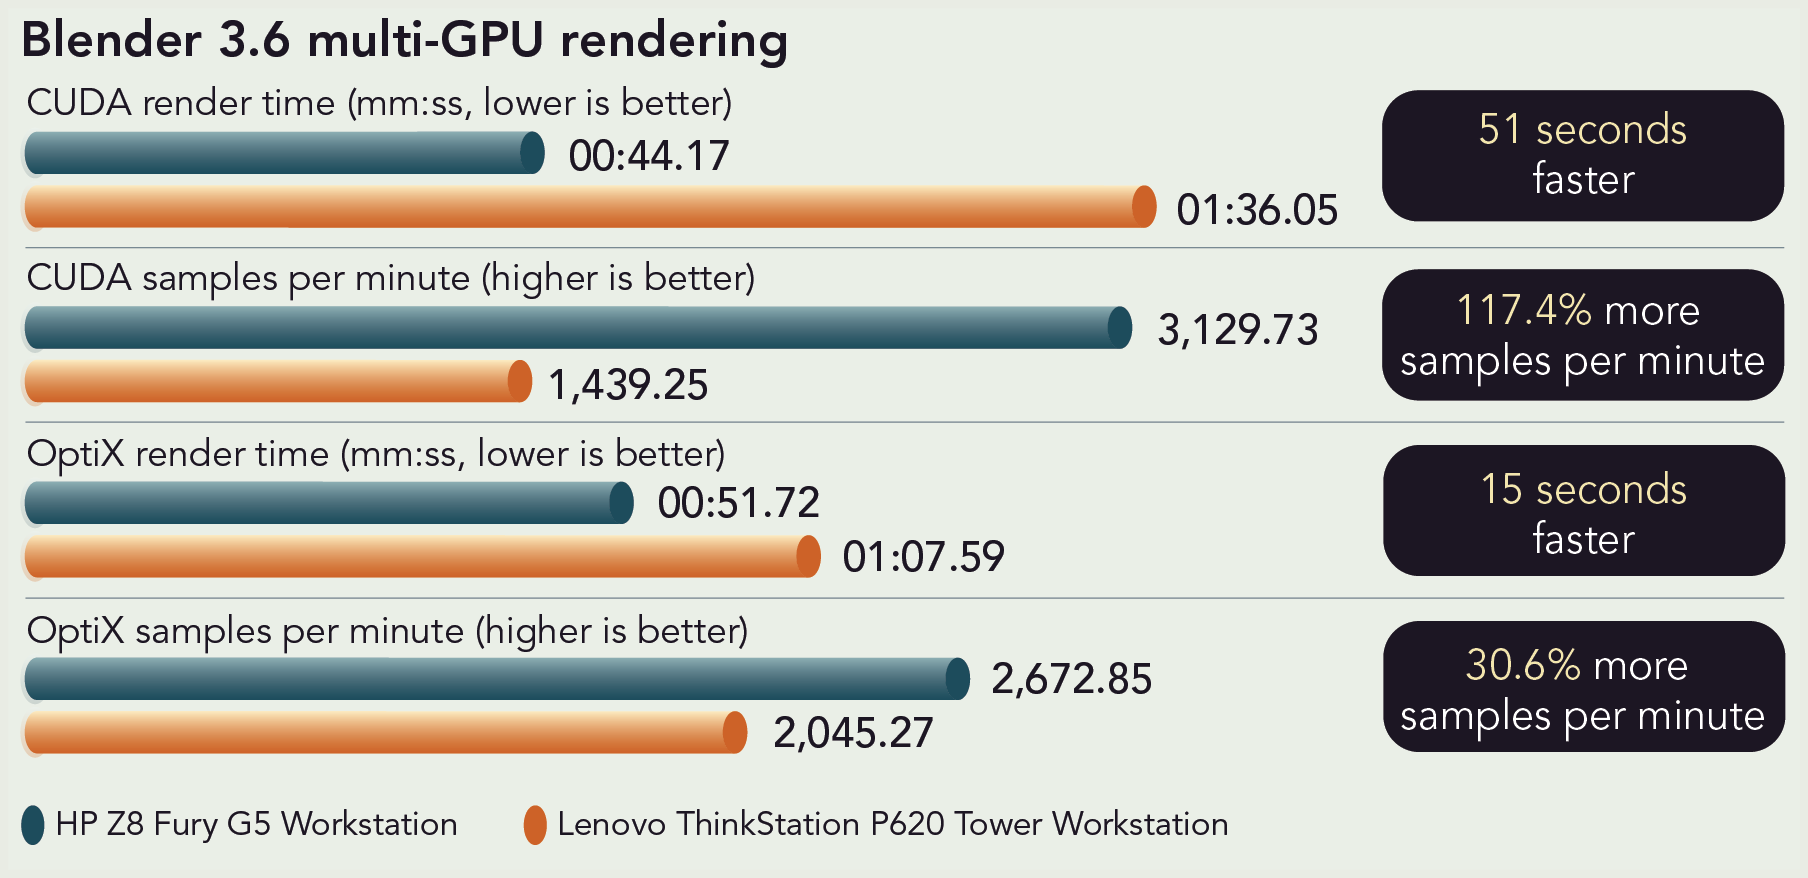
According to NVIDIA, the NVIDIA RTX 6000 Ada Generation graphics card “combines third-generation RT Cores, fourth-generation Tensor Cores, and next-generation CUDA® cores with 48 GB of graphics memory for unprecedented rendering, AI, graphics, and compute performance.”10 Much faster Blender 3.6 render times while processing significantly more samples per minute makes the dream reality.
Blender 3.6 ray-tracing render times and samples per minute with 200 percent resolution, 256 samples (2,304 total samples). Less time is better, and higher rates of samples per minute are better. Source: Principled Technologies.
Tackle complex AI/ML problems
According to Seed Scientific, at the beginning of 2020, the amount of data in the world was estimated at 44 zettabytes (a single zettabyte has 21 zeros). This humongous number includes data generated by “social media sites, financial institutions, medical facilities, shopping platforms, automakers, and many other activities online.”11 And, while your business may not want or need to process even 1 zettabyte of data, your digital transformation specialists, data analysts, business intelligence analysts, and scientists need powerful workstations that can nimbly crunch through your still-vast troves of valuable data and get usable results as quickly as possible.
The medical imaging, language processing, and computer vision scenarios we ran from the MLPerf Inference Benchmark Suite use trained models to measure how quickly each workstation processed inputs and produced results.12
Before we dive into our machine learning test results, it’s important to note that the final stage of the machine learning process is inference—that’s the time when your proven model has all the data, training, evaluation, and tuning your experts deem necessary for that machine learning model to make informed and (we hope) accurate predictions.13
Advance research endeavors and accurate medical treatment plans
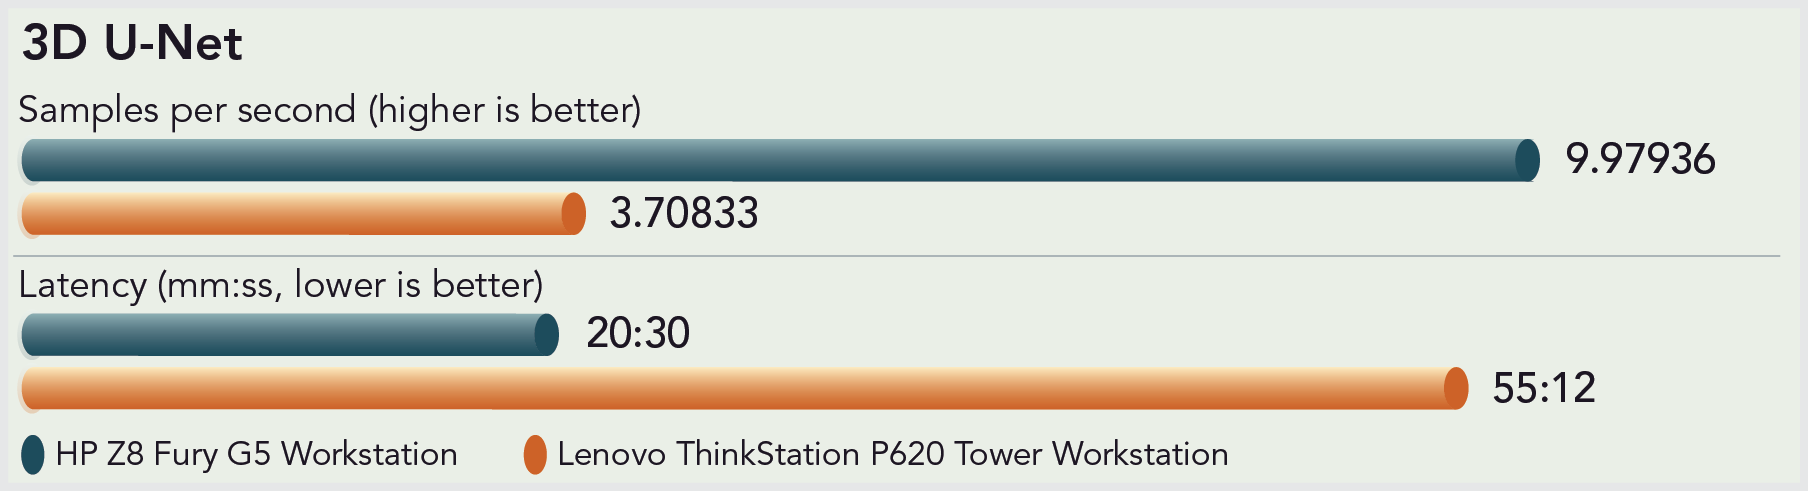
The healthcare sector uses medical imaging (e.g., X-rays, ultrasounds, MRIs, and CT scans) for medical research, disease diagnosis, and drug discovery.14 The 3D U-Net model we ran “performs volumetric segmentation of dense 3D images for medical use cases.”15 A higher number of samples here equals a cleaner image, which gives medical professionals an edge when a speedy and correct diagnosis can be the deciding factor in life and death situations.
Number of samples per second each workstation classified and latency using the 3D U-Net model in the offline scenario. Higher numbers of samples are better, and lower latency is better. Source: Principled Technologies.
Improve customer experiences
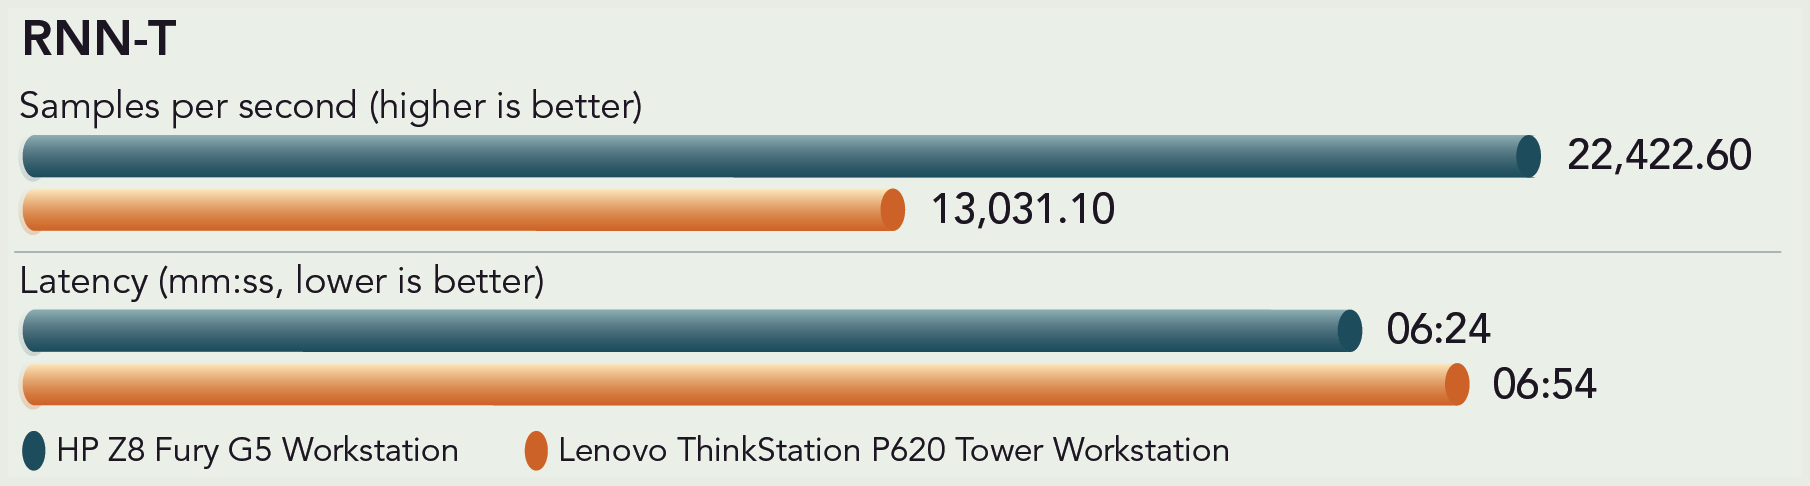
One of the earliest Natural Language Processing (NLP) applications was an email spam filter. Today, that recurrent neural network (RNN) aspect of NLP categorizes incoming emails as primary, social, promotional, or spam based on their contents.16 The RNN-T model we ran “recognizes and transcribes audio in real time.”17 Other examples of RNN applications are predicting stock prices, text mining, and language translation.18
Number of samples per second each workstation classified and mean latency using the RNN-T model in the offline scenario. Higher numbers of samples are better, and lower latency is better. Source: Principled Technologies.
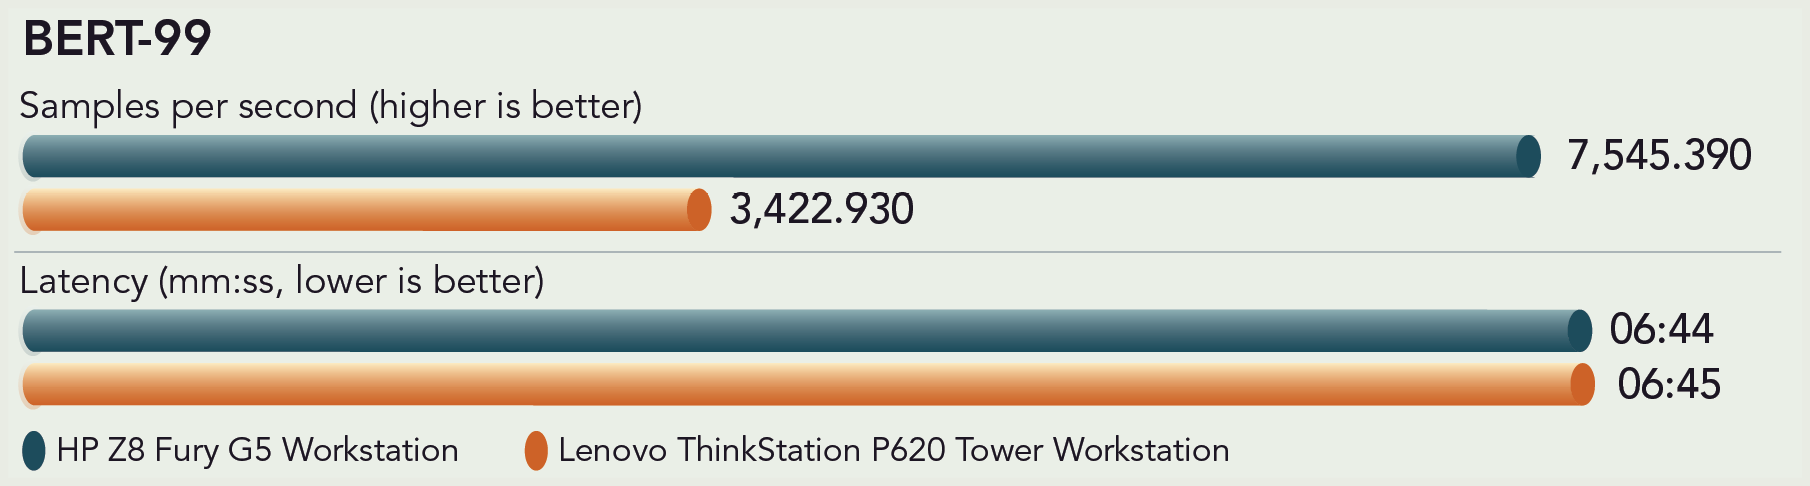
Another NLP model is BERT (Bidirectional Encoder Representations from Transformers). BERT, unlike RNN, which takes its text context from word order and punctuation, can “capture the semantic and syntactic features of a text.”19 The BERT model we ran sorts and analyzes text to make accurate language predictions, answer questions correctly, and respond to conversations without errors 99 percent of the time.20 Real-world examples of BERT applications include virtual assistants (e.g., Amazon® Alexa®, Google Assistant™, and Apple® Siri®), chatbots, image and video captioning, and sentiment analysis.21
Number of samples per second each workstation classified and latency using the BERT-99 model in the offline scenario. Higher numbers of samples are better, and lower latency is better. Source: Principled Technologies.
Achieve higher levels of productivity
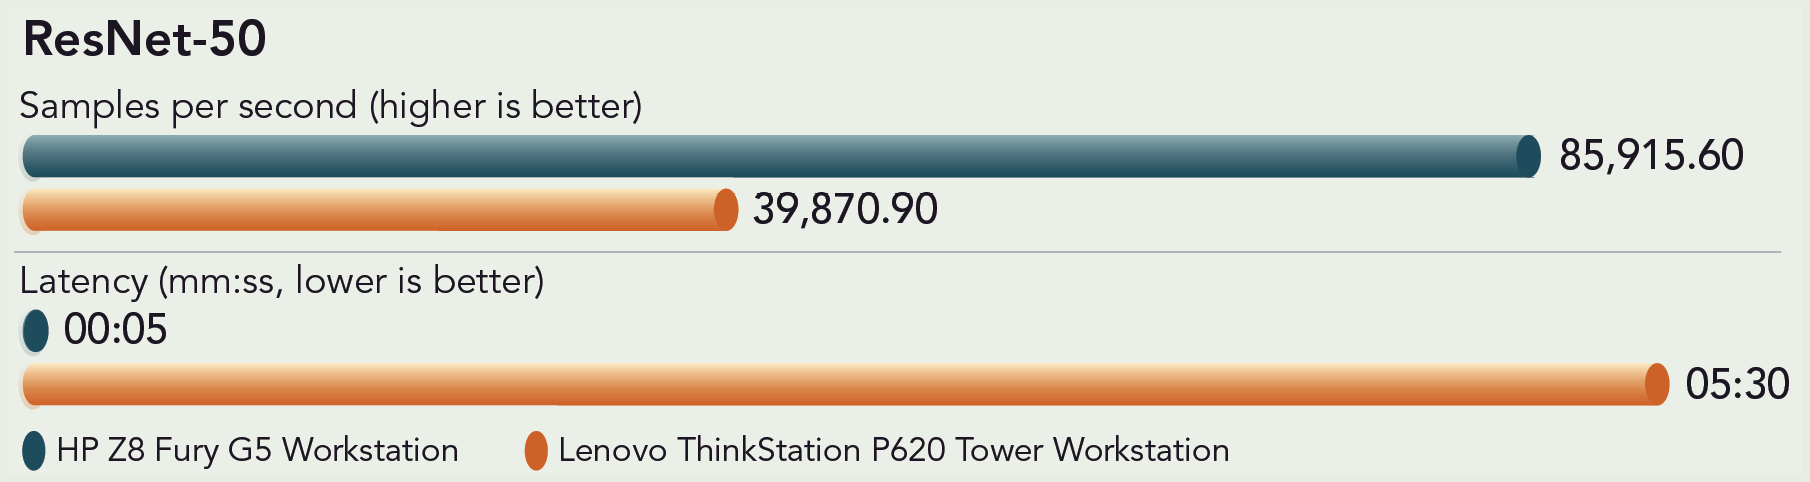
The 50-layer ResNet model we ran “[a]ssigns a label from a fixed set of categories to an input image, i.e., applies to computer vision problems.”22 Computer vision is a catch-all term for machine learning that enables computers to mimic human vision to see, identify, and understand both objects and people in images and video. Computer vision applications include facial recognition, autonomous cars, production-line automation, plant species classification, edge computing, and sports performance analysis.23
Number of samples per second each workstation classified and mean latency using the ResNet-50 model in the offline scenario. Higher numbers of samples are better, and lower latency is better. Source: Principled Technologies.
About the Intel Xeon W-3400 processor architecture
According to Intel, this new line of desktop workstation processors, which includes the Intel Xeon w9-3495X we tested, are purpose-built for media and entertainment creatives as well as engineering and data science professionals. With the “breakthrough new compute architecture, faster cores and new embedded multi-die interconnect bridge (EMIB) packaging, the Xeon W-3400 and W-2400 series of processors enable unprecedented scalability for increased performance.”24
By adopting big data solutions, making use of cloud computing technologies, and capitalizing on AI, companies are investing in their future success. With powerful workstations, your key personnel can get the results you need to electrify that bright future in less time. Our content creation and machine learning benchmark results show that the new HP Z8 Fury G5 Workstation powered by an Intel Xeon w9-3495X CPU and four NVIDIA RTX 6000 Ada-generation GPUs could be just the investment you need.
Principled Technologies is a registered trademark of Principled Technologies, Inc.
All other product names are the trademarks of their respective owners.
Principled Technologies disclaimer
Principled Technologies is a registered trademark of Principled Technologies, Inc. All other product names are the trademarks of their respective owners.
DISCLAIMER OF WARRANTIES; LIMITATION OF LIABILITY: Principled Technologies, Inc. has made reasonable efforts to ensure the accuracy and validity of its testing, however, Principled Technologies, Inc. specifically disclaims any warranty, expressed or implied, relating to the test results and analysis, their accuracy, completeness or quality, including any implied warranty of fitness for any particular purpose. All persons or entities relying on the results of any testing do so at their own risk, and agree that Principled Technologies, Inc., its employees and its subcontractors shall have no liability whatsoever from any claim of loss or damage on account of any alleged error or defect in any testing procedure or result.
In no event shall Principled Technologies, Inc. be liable for indirect, special, incidental, or consequential damages in connection with its testing, even if advised of the possibility of such damages. In no event shall Principled Technologies, Inc.’s liability, including for direct damages, exceed the amounts paid in connection with Principled Technologies, Inc.’s testing. Customer’s sole and exclusive remedies are as set forth herein.


 Twitter
 Facebook
 LinkedIn
 Email
Email