
A Principled Technologies report: Hands-on testing. Real-world results.

Enjoy smoother creative workflows with the HP Z2 Tower G1i Workstation Desktop PC
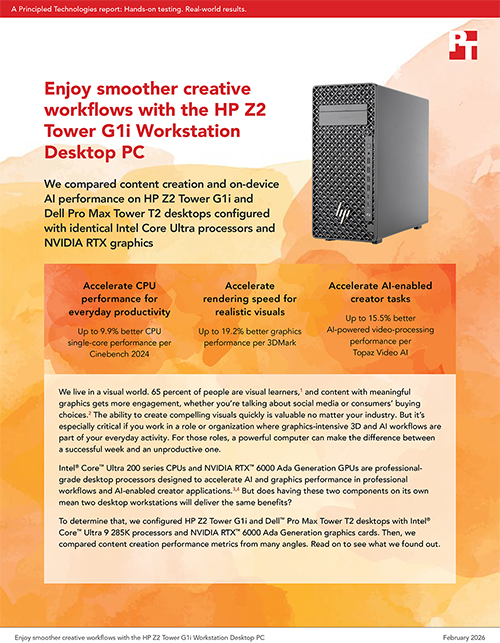
We compared content creation and on-device AI performance on HP Z2 Tower G1i and Dell Pro Max Tower T2 desktops configured with identical Intel Core Ultra processors and NVIDIA RTX graphics
We live in a visual world. 65 percent of people are visual learners,1 and content with meaningful graphics gets more engagement, whether you’re talking about social media or consumers’ buying choices.2 The ability to create compelling visuals quickly is valuable no matter your industry. But it’s especially critical if you work in a role or organization where graphics-intensive 3D and AI workflows are part of your everyday activity. For those roles, a powerful computer can make the difference between a successful week and an unproductive one.
Intel® Core™ Ultra 200 series CPUs and NVIDIA RTX™ 6000 Ada Generation GPUs are professional-grade desktop processors designed to accelerate AI and graphics performance in professional workflows and AI-enabled creator applications.3,4 But does having these two components on its own mean two desktop workstations will deliver the same benefits?
To determine that, we configured HP Z2 Tower G1i and Dell™ Pro Max Tower T2 desktops with Intel® Core™ Ultra 9 285K processors and NVIDIA RTX™ 6000 Ada Generation graphics cards. Then, we compared content creation performance metrics from many angles. Read on to see what we found out.
What we tested
We configured each of the Windows 11 Pro desktops we tested with an Intel® Core™ Ultra 9 285K processor, NVIDIA RTX™ 6000 Ada Generation graphics, 1 TB of NVMe® PCIe® Gen 4 storage, and 64 GB of DDR5-5600 memory.
HP Z2 Tower G1i Workstation Desktop PC
Powered by a 24-core Intel® Core™ Ultra 9 285K processor with a built-in neural processing unit (NPU), the HP Z2 Tower G1i Tower AI workstation contains an NVIDIA RTX™ graphics card, up to 36 TB of total storage and RAID, and up to 256 GB of DDR5-5600 memory.5 HP reengineered components and redesigned thermals to “support high-end graphics and seamlessly run both single and multi-threaded apps for fast modeling, simulation, and rendering.”6 Learn more.
Dell Pro Max Tower T2 Desktop
Powered by an Intel® Core™ Ultra 9 285K processor with a dedicated NPU, the Dell Pro Max Tower T2 integrates both Intel® and NVIDIA RTX™ graphics options, up to 4 TB of storage and RAID, and up to 128 GB of 128 GB of DDR5-5600 memory.7 Dell designed this business PC with “innovative internals, including CPU with unlimited turbo duration and NVIDIA pro graphics in a 32L chassis.”8 Learn more.
We compared content creation and on-device AI performance using these benchmarks and AI image and text generation tools:
- 3DMark®
- Amuse 3.1
- Automatic1111
- Blender
- Cinebench
- Geekbench 6 Pro
- Geekbench AI
- Procyon® AI Image Generation Benchmark
- Procyon AI Text Generation Benchmark
- Topaz Video AI 6

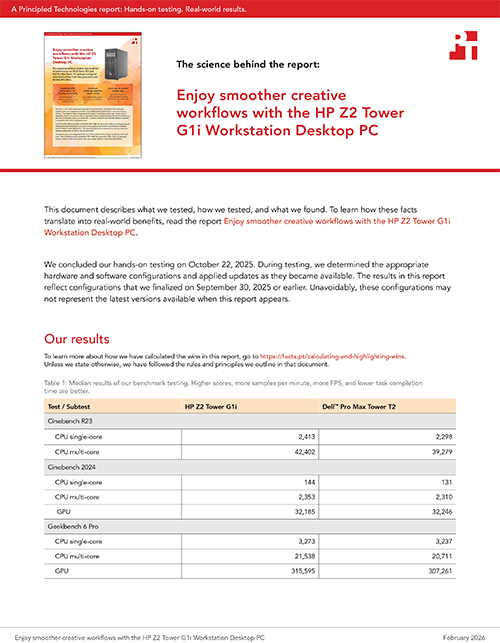
Note: The graphs in this report use different scales to keep a consistent size. Please be mindful of each graph’s data range as you compare.
Accelerate general productivity efforts
Reducing bottlenecks in routine activities can free up time for higher-value activities. Both desktops were powered by identical 24-core Intel® Core™ Ultra 9 285K processors and NVIDIA RTX™ 6000 Ada Generation graphics cards—but they did not perform equally in the following CPU-intensive benchmarks.
While both Cinebench benchmarks use the Cinema 4D rendering pipeline, Cinebench R23 utilizes the legacy Cinema 4D rendering engine to measure CPU performance, and Cinebench 2024 utilizes the newer Redshift engine to measure CPU and GPU performance. The Cinebench 2024 scene is also more memory-intensive and compute-heavy than the Cinebench R23 scene.


The Geekbench 6 Pro benchmark measures CPU and GPU performance in real-world scenarios, including applying background blur effects, applying filters to or editing images, identifying objects and people in photos, analyzing and converting text, and more.11


The higher Cinebench R23, Cinebench 2024, and Geekbench 6 Pro CPU scores indicate the HP Z2 Tower G1i can handle demanding office tasks involving spreadsheets, presentations, and document processing more quickly than the Dell Pro Max Tower T2. Better multi-core performance also indicates that the HP Z2 Tower G1i should operate more smoothly than the Dell Pro Max Tower T2 when power users have many tabs open at once or are running multiple applications simultaneously.
Accelerate graphics rendering tasks
3D software has intensive hardware requirements, and rendering is one of the most demanding tasks this software performs. We pushed the HP Z2 Tower G1i and Dell Pro Max Tower T2 desktops to their limits in multiple rendering scenarios.
The 3DMark benchmark evaluates graphics rendering performance by running game-like scenes built on DirectX and Vulkan APIs.12 Each of the 3DMark workloads stresses the CPU and GPU in different ways:
- Fire Strike Extreme tests DirectX 11 performance at 1440p resolution.
- Port Royal tests real-time ray-tracing performance.
- Steel Nomad Light Unlimited tests non-ray-tracing performance for light graphics workloads.
- Time Spy Extreme tests 4K DirectX 12 performance.
- Wild Life Extreme Unlimited tests GPU performance for light to medium graphics workloads.13

Blender Benchmark measures how quickly Cycles and EEVEE engines can render path-tracing samples in the system under test. Each of the 3D Blender scenes stresses the hardware in different ways, allowing you to reference the score that best matches the type of work you do:
- Classroom uses the Cycles engine.
- Monster uses the EEVEE engine.
- The Junk Shop uses the Cycles engine and renders a complex 3D splash screen.14

The higher 3DMark and Blender benchmark scores indicate the HP Z2 Tower G1i better supports advanced graphics features and faster render times for complex 3D scenes compared to the Dell Pro Max Tower T2.
Accelerate AI-enabled creator tasks
Business adoption of generative AI (GenAI) and chatbots powered by large language models (LLMs) is expanding. Enhanced on-device AI performance empowers those tasked with content creation to innovate, iterate rapidly, and manage large-scale projects with greater agility.
To evaluate each desktop’s ability to handle on-device GenAI-assisted content creation tasks, we generated images and videos with the AI art creation tool, Amuse 3.1.15 You might expect video generation to take longer than image generation, but in our testing, that wasn’t the case. This is because Amuse 3.1 image generation uses a model optimized for fine-grained detail and photorealism, and Amuse 3.1 video generation uses a model optimized for speed.16 Both are valuable metrics to understand when you’re considering a system for AI-enabled content generation tasks.

We also generated an image using the Automatic1111 Stable Diffusion web UI tool.17 Stable Diffusion 1.5 is an open-source image model that generates photorealistic images from text prompts.18

Procyon AI Image Generation Benchmark measures the inference performance of on-device AI accelerators.19 The Stable Diffusion XL test is more demanding than the Stable Diffusion 1.5 test; we ran both tests to capture a more comprehensive picture of performance.

Procyon AI Text Generation Benchmark measures on-device small language model (SLM) and LLM performance.20 These are the models and their use cases:
- Llama 2 models automate natural language processing (NLP) tasks. These LLMs are helpful for handling queries across different languages in customer service chatbot scenarios.21
- Llama 3 models take NLP task automation a step further, with improved reasoning, summarization, and translation capabilities. You might use this LLM for conversational-level support of nuanced customer queries, code generation, and symptom analysis and treatment recommendations in intelligent chatbot scenarios.22
- Mistral models automate business processes. Companies including banks, insurance companies, and e-commerce stores use this LLM for customer support, content generation, and to develop interactive online learning materials.23
- Phi-3.5 models are valuable for generative AI applications. This SLM powers virtual assistants, AI agents, chatbots, and on-device AI.24

Topaz Video is AI-powered video enhancement software. According to Topaz Labs®, this software enables users to “denoise low-light footage, recover and upscale old archival videos to 4K, restore focus, and adjust frame rate by creating new frames out of thin air.”25 The Topaz Video AI benchmark measures raw AI processing speed. It reports frames per second (FPS) for video upscaling (2x and 4x) and frame interpolation (SlowMo) at Full HD (1,920 x 1,080) and 4K (3,840 x 2,160) resolutions, using Iris, Proteus, Gaia, and Apollo AI models.26 Higher scores here indicate more raw AI processing speed, which can help shorten project iteration and completion times.

The higher benchmark scores in this area and faster text-prompted image and video creation indicate the HP Z2 Tower G1i can put your teams in a better position to handle emerging GenAI and chatbot-driven AI tasks versus an identically configured Dell Pro Max Tower T2.
Accelerate on-device machine learning workflows
By processing data locally, businesses and creators gain real-time insights, reduce latency, and enhance data privacy. And investing in desktops that go the extra mile can help you and your teams deliver results faster. In addition to faster data analysis and content generation, better on-device AI performance can enhance the user experience when interacting with applications that rely on AI (e.g., voice assistants, real-time translation, and photo enhancement) without also relying on cloud connectivity.
The Geekbench AI benchmark measures real-world machine learning (ML) performance using LLMs.27 Geekbench AI workloads cover a range of precision levels based on speed and accuracy requirements:
- Single Precision (FP32) prioritizes precision over speed for real-time graphics rendering, financial modeling, and scientific simulation scenarios.
- Half Precision (FP16) balances speed and precision for situations where visual perception is more important than numerical accuracy.
- Quantized (INT8) prioritizes speed over precision for edge computing, real-time language translation, and opinion-mining scenarios.

The generally higher Geekbench AI benchmark scores indicate the HP Z2 Tower G1i is better able to handle CPU-intensive on-device AI workloads—such as image recognition, natural language processing, and predicative analytics—in comparison to the Dell Pro Max Tower T2.
Conclusion
When configured with the same high-end Intel® Core™ Ultra 9 285K processor and NVIDIA RTX™ 6000 Ada Generation graphics, the HP Z2 Tower G1i delivered measurable content creation and on-device AI performance advantages over the Dell Pro Max Tower T2. These gains translate to faster rendering, quicker AI-assisted image and video generation, and improved responsiveness for creative and machine learning workflows—making the HP Z2 Tower G1i the stronger choice for professionals prioritizing raw performance and faster iteration times.

 Twitter
 Facebook
 LinkedIn
 Email
Email- Soyiba Jawed et. al., “Classification of Visual and Non-visual Learners Using Electroencephalographic Alpha and Gamma Activities,” accessed December 14, 2025, https://pmc.ncbi.nlm.nih.gov/articles/PMC6513874/.
- Bernard Schroeder, “Industry Studies And Insights On Why You Need To Choose Better Photos For Your Marketing Efforts,” accessed December 14, 2025, https://www.forbes.com/sites/bernhardschroeder/2022/10/12/industry-studies-and-insights-on-why-you-need-to-choose-better-photos-for-your-marketing-efforts/.
- Intel, “Intel Launches First AI PC Intel Core Ultra Desktop Processors,” accessed December 14, 2025, https://newsroom.intel.com/client-computing/core-ultra-200s-series-desktop.
- NVIDIA, “NVIDIA Redefines Workstations To Power New Era of AI, Design, Industrial Metaverse,” accessed December 14, 2025, https://investor.nvidia.com/news/press-release-details/2023/NVIDIA-Redefines-Workstations-to-Power-New-Era-of-AI-Design-Industrial-Metaverse/default.aspx.
- HP, “Mainstream Workstation Performance—Reimagined,” accessed December 14, 2025, https://www.hp.com/us-en/workstations/z2-tower.html.
- HP, “Mainstream Workstation Performance—Reimagined.”
- Dell Technologies, “Dell Pro Max Tower T2 Desktop,” accessed December 14, 2025, https://www.dell.com/en-us/shop/desktop-computers/dell-pro-max-tower-t2-desktop/spd/dell-pro-max-fct2250-desktop/xcto_fct2250_usx?redirectto=SOC&configurationid=56a122e2-ec40-4fe1-bd50-672cc36e5f7c.
- Dell Technologies, “Dell Pro Max Tower T2 Desktop,” accessed December 14, 2025, https://www.dell.com/en-us/shop/cty/pdp/spd/dell-pro-max-fct2250-desktop.
- Intel, “Intel® Core™ Ultra 9 Processor 285K,” accessed December 14, 2025, https://www.intel.com/content/www/us/en/products/sku/241060/intel-core-ultra-9-processor-285k-36m-cache-up-to-5-70-ghz/specifications.html.
- Intel, “Intel® Core™ Ultra Desktop Processors (Series 2) Product Brief,” accessed December 14, 2025, https://www.intel.com/content/www/us/en/products/docs/processors/core-ultra/core-ultra-desktop-processors-series-2-brief.html.
- Geekbench, “Geekbench 6 Benchmark Internals, “ accessed December 15, 2025, https://www.geekbench.com/doc/geekbench6-benchmark-internals.pdf.
- UL Solutions, “3DMark,” accessed December 15, 2025, https://benchmarks.ul.com/3dmark.
- UL Solutions, “3DMark.”
- Blender, “Asset Bundles,” accessed December 15, 2025, https://www.blender.org/download/demo-files/.
- AMD, “Introducing The World’s First BF16 NPU Model for SD 3.0 Medium – Try Now in Amuse 3.1,” accessed December 15, 2025, https://www.amd.com/en/blogs/2025/worlds-first-bf16-sd3-medium-npu-model.html.
- AMD, “Introducing The World’s First BF16 NPU Model for SD 3.0 Medium – Try Now in Amuse 3.1.”
- GitHub, “AUTOMATIC1111/ Stable-diffusion-webui,” accessed December 15, 2025, https://github.com/AUTOMATIC1111/stable-diffusion-webui.
- Rob Laughter, “A Crash Course on Local Image Generation with Stable Diffusion,” accessed December 15, 2025, https://roblaughter.medium.com/a-crash-course-on-local-image-generation-with-stable-diffusion-f72dfd3de3df.
- UL Solutions, “Procyon™ AI Image Generation Benchmark,” accessed December 15, 2025, https://benchmarks.ul.com/procyon/ai-image-generation-benchmark.
- UL Solutions, “Procyon® AI Text Generation Benchmark,” accessed December 15, 2025, https://benchmarks.ul.com/procyon/ai-text-generation-benchmark.
- Kanerika, “Llama 3 vs Llama 2 in 2025 – Use-case Guide & Decision Framework,” accessed December 8, 2025, https://kanerika.com/blogs/llama-3-vs-llama-2/.
- Kanerika, “Llama 3 vs Llama 2 in 2025 – Use-case Guide & Decision Framework.”
- Latenode, “What is Mistral 7B and How Can It Supercharge Your Business Processes?” accessed December 8, 2025, https://latenode.com/blog/ai-technology-language-models/mistral-ai/what-is-mistral-7b-and-how-can-it-supercharge-your-business-processes.
- Carl Franzen, “Microsoft releases powerful new Phi-3.5 models, beating Google, OpenAI, and more,” accessed December 8, 2025, https://venturebeat.com/ai/microsoft-releases-powerful-new-phi-3-5-models-beating-google-openai-and-more.
- Topaz Labs, “Topaz Video,” accessed December 15, 2025, https://www.topazlabs.com/topaz-video.
- Topaz Labs, “Benchmark vs real performance,” accessed December 15, 2025, https://community.topazlabs.com/t/benchmark-vs-real-performance/51554.
- John Poole, “Geekbench AI 1.0,” accessed December 15, 2025, https://www.geekbench.com/blog/2024/08/geekbench-ai/.
This project was commissioned by HP.
February 2026
Principled Technologies is a registered trademark of Principled Technologies, Inc.
All other product names are the trademarks of their respective owners.
Principled Technologies disclaimer
Principled Technologies is a registered trademark of Principled Technologies, Inc.
All other product names are the trademarks of their respective owners.
DISCLAIMER OF WARRANTIES; LIMITATION OF LIABILITY:
Principled Technologies, Inc. has made reasonable efforts to ensure the accuracy and validity of its testing, however, Principled Technologies, Inc. specifically disclaims any warranty, expressed or implied, relating to the test results and analysis, their accuracy, completeness or quality, including any implied warranty of fitness for any particular purpose. All persons or entities relying on the results of any testing do so at their own risk, and agree that Principled Technologies, Inc., its employees and its subcontractors shall have no liability whatsoever from any claim of loss or damage on account of any alleged error or defect in any testing procedure or result.
In no event shall Principled Technologies, Inc. be liable for indirect, special, incidental, or consequential damages in connection with its testing, even if advised of the possibility of such damages. In no event shall Principled Technologies, Inc.’s liability, including for direct damages, exceed the amounts paid in connection with Principled Technologies, Inc.’s testing. Customer’s sole and exclusive remedies are as set forth herein.
Image close up


