A Principled Technologies report: Hands-on testing. Real-world results.
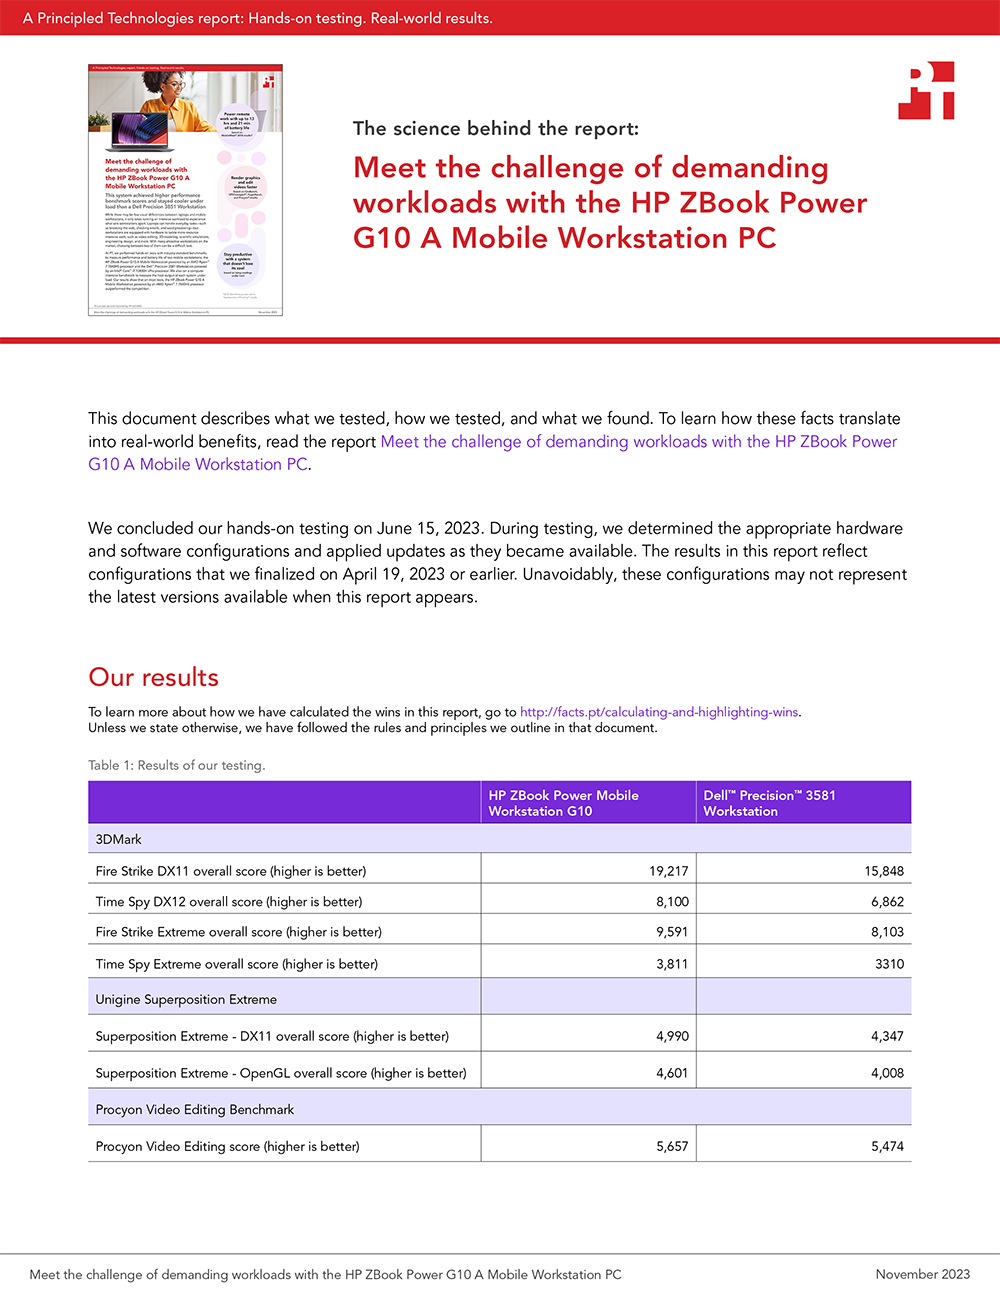
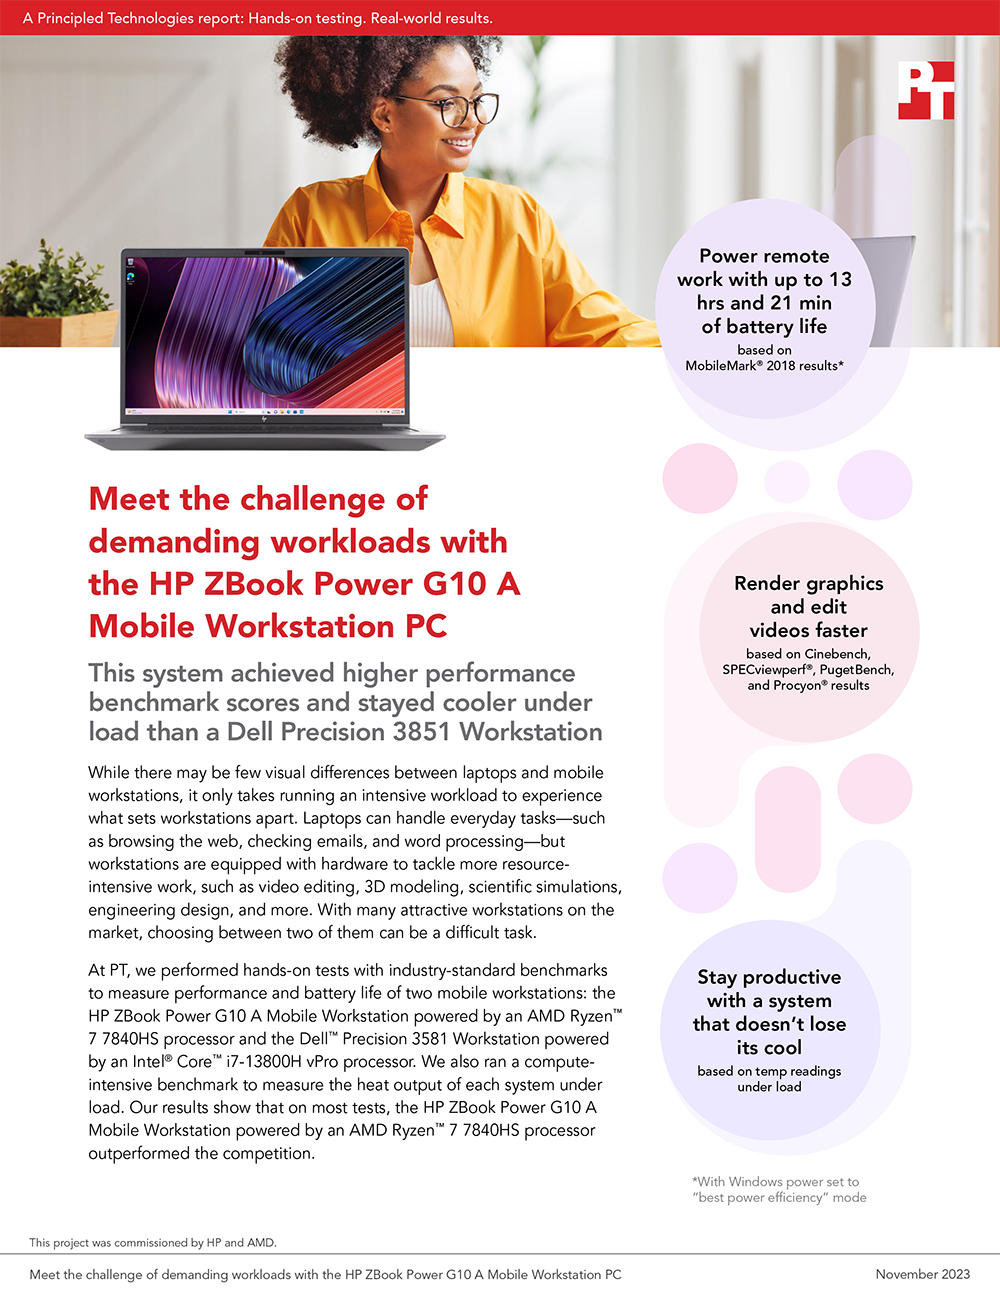
Meet the challenge of demanding workloads with the HP ZBook Power G10 A Mobile Workstation PC
This system achieved higher performance benchmark scores and stayed cooler under load than a Dell Precision 3851 Workstation
While there may be few visual differences between laptops and mobile workstations, it only takes running an intensive workload to experience what sets workstations apart. Laptops can handle everyday tasks—such as browsing the web, checking emails, and word processing—but workstations are equipped with hardware to tackle more resource-intensive work, such as video editing, 3D modeling, scientific simulations, engineering design, and more. With many attractive workstations on the market, choosing between two of them can be a difficult task.
At PT, we performed hands-on tests with industry-standard benchmarks to measure performance and battery life of two mobile workstations: the HP ZBook Power G10 A Mobile Workstation powered by an AMD Ryzen™ 7 7840HS processor and the Dell™ Precision 3581 Workstation powered by an Intel® Core™ i7-13800H vPro processor. We also ran a compute-intensive benchmark to measure the heat output of each system under load. Our results show that on most tests, the HP ZBook Power G10 A Mobile Workstation powered by an AMD Ryzen™ 7 7840HS processor outperformed the competition.
What we tested
Before we started testing, we set the workstations to “best performance” power mode. For the MobileMark 2018 battery life tests, we set screen brightness to 200 nits and conducted “best performance” and “best power efficiency” power mode comparisons. We then reset screen brightness to 250 nits for the MobileMark 25 battery life comparisons. Other than making and verifying those changes, we used out-of-box OEM performance settings for both systems. We tested the following systems:
We ran the following performance-based benchmark tests:
Cinebench R23
PugetBench for DaVinci Resolve
PugetBench for Premiere Pro
SPECviewperf® 2020
Procyon Video Editing Benchmark
PassMark PerformanceTest 11
3DMark® Fire Strike
3DMark Fire Strike Extreme
3DMark Time Spy
3DMark Time Spy Extreme
Unigine Superposition Extreme
To test battery life and efficiency, we ran MobileMark 2018 and MobileMark 25 benchmarks twice—once in “best performance” power mode and again in “best power efficiency” power mode. For our surface temperature tests, we ran a sustained CPU-intensive Cinebench R23 workload for 50 minutes, taking keyboard and bottom hot spot temperature readings every 10 minutes.
The benchmark scores and battery life results we report reflect the specific configurations we tested. Any difference in the configurations you test, as well as screen brightness, network traffic, or software additions, can affect these results. For a deeper dive into our testing parameters and procedures, see the science behind the report.
Performance benchmark results: Keep productivity flowing, even during intensive work
Equipped with powerful capabilities, mobile workstations thrive under taxing workloads. Our hands-on testing indicates how well systems can handle tasks such as multimedia editing, 3D modeling, graphics rendering, data analysis, and more.
Whether you’re working under a tight deadline or multi-tasking to stay ahead of the curve, a device that helps complete work faster, offers longer battery life, and remains cool can enable better productivity.
About the HP ZBook Power G10 A
Aimed at professionals looking for performance, durability, and security, the HP ZBook Power G10 A is a 15.6-inch laptop with customizable features. According to HP, this model comes equipped with “enhanced collaboration features and pro-grade components to run pro software apps for CAD, 3D concepting, modeling, rendering and more.”1
This AMD Ryzen™ 7040HS Series processor for mobile is built on Zen 4 architecture and 4nm process technology.2 The AMD Ryzen™ 7 7840HS processor has eight cores with 16 threads, integrated AMD Radeon™ graphics, and PCIe 4.0 connectivity.3
Complete editing and rendering work faster
We used a variety of graphics- and video-editing-based benchmarks to measure system performance. The Cinebench R23 benchmark measures system performance by completing common Cinema 4D tasks that tax multiple CPU cores and modern processor features.4 The PugetBench for DaVinci Resolve benchmark measures rendering with different codecs and OpenFX, along with Fusion performance.5 Similarly, PugetBench for Premiere Pro focuses on encoding, processing, and GPU effects performance.6 SPECviewperf® 2020 uses multiple workloads that represent “actual workstation-class applications” to measure 3D graphics performance using both OpenGL and DirectX interfaces.7 Finally, the Procyon Video Editing Benchmark also uses Premiere Pro, and says it ensures that “the benchmark score reflects the real-world performance of the whole system.”8 PassMark PerformanceTest gathers CPU, disk, memory, and 2D/3D graphics performance metrics and combines these to create a single, overall score—the bigger the score rating, the faster the device.9
Key graphics and video-editing takeaways
Compared to the Precision 3581, the ZBook Power G10 A we tested received a 33.3 percent higher performance score from Cinebench R23 multi-core and a 20.1 percent higher score from PugetBench for DaVinci Resolve.
In SPECviewperf® tests, the ZBook Power G10 received higher scores in six of the eight workloads—as much as 16.8 percent higher than the Precision 3581 in the SNX workload. It received a Creo composite score lower than the Precision 3581 and a roughly equivalent Medical composite score.
The ZBook Power G10 A and Precision 3581 achieved comparable scores from PugetBench for Premiere Pro, Procyon Video Editing, and PassMark PerformanceTest 11.
PugetBench for DaVinci Resolve benchmark results. Higher is better. Source: Principled Technologies.
PugetBench for Premiere Pro benchmark results. Higher is better. Source: Principled Technologies.
SPECviewperf® benchmark results. Higher is better. Source: Principled Technologies.
Procyon Video Editing benchmark results. Higher is better. Source: Principled Technologies.
PassMark PerformanceTest 11 results. Higher is better. Source: Principled Technologies.
Rise to the occasion of demanding workloads
We also put the systems to the test with game-based benchmarks. The 3DMark Fire Strike benchmark stresses the CPU and GPU to gauge how well systems handle real-time graphics, while Fire Strike Extreme tests multi-GPU systems with a more intensive rendering workload.10 3DMark Time Spy is “the ideal test for benchmarking the latest graphics cards,” and Time Spy Extreme is “an ideal benchmark test for the latest high-end graphics cards,” with a redesigned CPU test optimized for processors with eight or more cores.11 Additionally, we ran the Unigine Superposition Extreme benchmark—which tests the performance and stability of system’s video card, power supply, and cooling12—with both OpenGL and DirectX 11 graphics APIs. While both types have “become fundamental to game development over the last couple of decades,” OpenGL deals with 2D and 3D graphics, and DirectX includes APIs for graphics, audio, networking, and more.13
Key game-based takeaways
On each of the game-based benchmarks, the ZBook Power G10 A achieved higher scores than the Precision 3581.
On the four 3DMark benchmarks we ran, the ZBook Power G10 A delivered wins ranging from 15.1 percent higher (Time Spy Extreme) to 21.2 percent higher (Fire Strike).
Running Unigine Superposition Extreme with OpenGL and DirectX 11 APIs, we found that the ZBook Power G10 A scored 14.7 percent higher on both.
3DMark Fire Strike and Fire Strike Extreme benchmark results. Higher is better. Source: Principled Technologies.
3DMark Time Spy and Time Spy Extreme benchmark results. Higher is better. Source: Principled Technologies.
Although not everyone uses their device for gaming, higher scores with these benchmarks can translate to a more responsive device when using demanding productivity apps, financial analysis tools, product development and design software, computer-aided design (CAD) programs, and scientific simulation software.
Note: The graphs in this section use different x-axis scales to keep to a consistent size. Please be mindful of each graph’s data range as you compare.
Battery life and efficiency results: Extend your productivity, not your power cord
Some users may enjoy the consistency of working from the same place day in and day out, but others need a change of scenery to spark their creativity or maintain their focus. And with busy schedules and business travel, some hybrid and remote workers may not have the option to work from a the same place every day. Instead, these digital nomads deftly check items off their to-do lists from coworking spaces, train stations, passenger seats, and more.
Whether your workforce travels the globe or across town, a device that can power a workday—or more, depending on when creativity strikes—can minimize interruptions such as startling battery warnings or searching for an outlet. We tested the HP and Dell workstations in different configurations with two benchmarks designed to stress systems’ battery life. The first, MobileMark 2018, measures battery life and performance at the same time. Using real applications, workloads, and data sets, it quantifies how overall system performance affects the user experience.14 The second benchmark, MobileMark 25, puts devices through scenarios based on the real-world applications and activities business users encounter every day.15
Key battery life takeaways
In our MobileMark 2018 battery life tests, when we set both devices to “best power efficiency” power mode, the HP ZBook Power G10 A Mobile Workstation powered by an AMD Ryzen™ 7 7840HS processor kept working over an hour longer, received an 82 percent higher performance score, and was 27.8 percent more efficient than the Dell Precision 3581 Workstation powered by an Intel Core i7-13800H vPro processor.
In our MobileMark 25 battery life tests, when we set both devices to “best power efficiency” power mode, the HP ProBook 445 G10 HP ZBook Power G10 A Mobile Workstation powered by an AMD Ryzen™ 7 7840HS processor worked nearly the same amount of time—11 minutes less—received a 73.4 percent higher performance score, and was 14.8 percent more efficient than the Dell Precision 3581 Workstation powered by an Intel Core i7-13800H vPro processor.
Although the HP ZBook Power G10 A Mobile Workstation had a smaller battery (83WHr compared to the 97WHr battery of the Dell Precision 3581 Workstation), it achieved longer battery life in three of the four tests, higher scores in two of the four tests, and better efficiency in all four tests.
MobileMark 2018 battery life (“best power efficiency” mode) benchmark results. Higher is better. Source: Principled Technologies.
MobileMark 2018 battery life (“best performance” mode) benchmark results. Higher is better. Source: Principled Technologies.
MobileMark 25 battery life (“best power efficiency” mode) benchmark results. Higher is better. Source: Principled Technologies.
MobileMark 25 battery life (best “performance mode”) benchmark results. Higher is better. Source: Principled Technologies.
For more information on the test devices, our screen brightness (nit) choices, and testing parameters and procedures, see the science behind the report.
Thermal testing results: Staying cool (and productive) under pressure
The work you do on your mobile workstation demands a lot—both from you and from your device. While benchmarking human performance is a bit beyond the scope of this study, we can offer a look at the performance of HP and Dell workstations during intense workloads. When workstation processors are working hard, they can put out a lot of heat. This can result in some discomfort for a user—or even drops in system performance.
Running the Cinebench R23 benchmark several times consecutively to strain the systems, we saw that the HP ZBook Power G10 A Mobile Workstation PC delivered a 24.9 percent higher performance score. And it did so while staying cooler than the Dell Precision 3581 Workstation on both the top and bottom hot spots we measured.
Key thermal takeaways
When we stressed the systems with a sustained Cinebench R23 multi-core workload, the HP ZBook Power G10 A Mobile Workstation powered by an AMD Ryzen™ 7 7840HS processor maintained cooler surface temperatures than the Dell Precision 3581 Workstation powered by an Intel Core i7-13800H vPro processor.
While measuring cooler on top and bottom hot spots, the HP ZBook Power G10 A Mobile Workstation powered by an AMD Ryzen™ 7 7840HS processor also received a 24.9 percent higher Cinebench R23 multi-core score.
Thermal testing results. A higher score is better, and lower temperatures are better. Source: Principled Technologies.
With the ability to handle tough workloads on the go, a mobile workstation can be a wise investment for creative and engineering professionals, or anyone who needs to accomplish resource-intensive work. In most of the graphic, video, and gaming performance benchmarks in our tests, the HP ZBook Power G10 A Mobile Workstation powered by an AMD Ryzen™ 7 7840HS processor outperformed the Dell Precision 3581 Workstation powered by an Intel Core i7-13800H vPro processor. Our battery life testing demonstrates that even with its smaller battery capacity, the HP ZBook Power G10 A Mobile Workstation can deliver longer battery life, greater system efficiency, and higher performance. Additionally, the HP ZBook Power G10 A Mobile Workstation powered by an AMD Ryzen™ 7 7840HS processor not only ran cooler than the Dell Precision 3581 Workstation powered by an Intel Core i7-13800H vPro processor under a sustained Cinebench R23 workload, but did so while achieving a higher performance score.
Principled Technologies is a registered trademark of Principled Technologies, Inc.
All other product names are the trademarks of their respective owners.
Principled Technologies disclaimer
Principled Technologies is a registered trademark of Principled Technologies, Inc. All other product names are the trademarks of their respective owners.
DISCLAIMER OF WARRANTIES; LIMITATION OF LIABILITY: Principled Technologies, Inc. has made reasonable efforts to ensure the accuracy and validity of its testing, however, Principled Technologies, Inc. specifically disclaims any warranty, expressed or implied, relating to the test results and analysis, their accuracy, completeness or quality, including any implied warranty of fitness for any particular purpose. All persons or entities relying on the results of any testing do so at their own risk, and agree that Principled Technologies, Inc., its employees and its subcontractors shall have no liability whatsoever from any claim of loss or damage on account of any alleged error or defect in any testing procedure or result.
In no event shall Principled Technologies, Inc. be liable for indirect, special, incidental, or consequential damages in connection with its testing, even if advised of the possibility of such damages. In no event shall Principled Technologies, Inc.’s liability, including for direct damages, exceed the amounts paid in connection with Principled Technologies, Inc.’s testing. Customer’s sole and exclusive remedies are as set forth herein.


 Twitter
 Facebook
 LinkedIn
 Email
Email