A Principled Technologies report: Hands-on testing. Real-world results.
Optimize creative and design workflows and enjoy a better user experience with the Dell Precision 5680
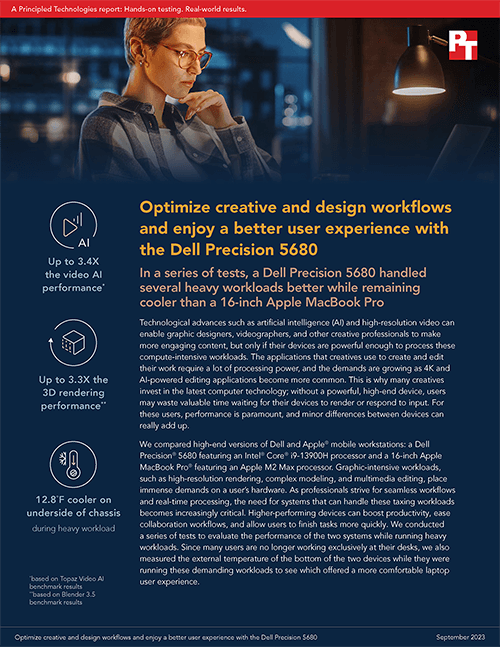
In a series of tests, a Dell Precision 5680 handled several heavy workloads better while remaining cooler than a 16-inch Apple MacBook Pro
Technological advances such as artificial intelligence (AI) and high-resolution video can enable graphic designers, videographers, and other creative professionals to make more engaging content, but only if their devices are powerful enough to process these compute-intensive workloads. The applications that creatives use to create and edit their work require a lot of processing power, and the demands are growing as 4K and AI-powered editing applications become more common. This is why many creatives invest in the latest computer technology; without a powerful, high-end device, users may waste valuable time waiting for their devices to render or respond to input. For these users, performance is paramount, and minor differences between devices can really add up.
We compared high-end versions of Dell and Apple® mobile workstations: a Dell Precision® 5680 featuring an Intel® Core® i9-13900H processor and a 16-inch Apple MacBook Pro® featuring an Apple M2 Max processor. Graphic-intensive workloads, such as high-resolution rendering, complex modeling, and multimedia editing, place immense demands on a user’s hardware. As professionals strive for seamless workflows and real-time processing, the need for systems that can handle these taxing workloads becomes increasingly critical. Higher-performing devices can boost productivity, ease collaboration workflows, and allow users to finish tasks more quickly. We conducted a series of tests to evaluate the performance of the two systems while running heavy workloads. Since many users are no longer working exclusively at their desks, we also measured the external temperature of the bottom of the two devices while they were running these demanding workloads to see which offered a more comfortable laptop user experience.
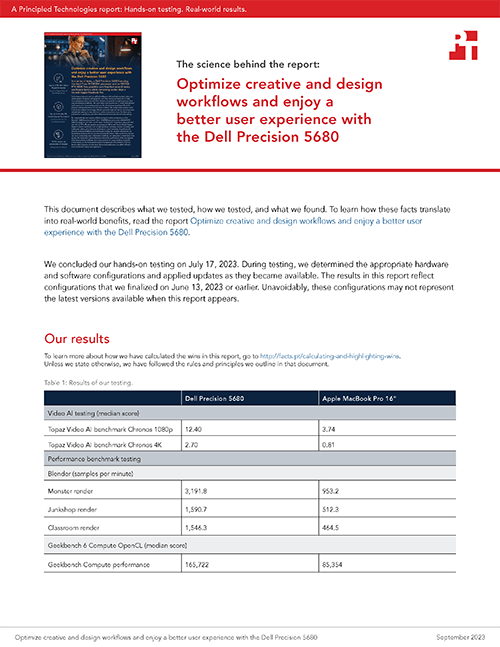
Based on the results of our tests, users who want high performance while running demanding workloads should consider the Dell Precision 5680 workstation. Notably, the Precision 5680 workstation offered up to 3.4x the video AI performance and up to 3.3x the 3D rendering performance of the 16-inch MacBook Pro we tested. For a creative professional using Topaz AI to enhance a video clip, the Precision 5680 workstation could render the clip in 10 minutes when the MacBook Pro would need over half an hour. For bigger projects, these types of delays can add up to hours and days of lost productivity. Not only did the Precision 5680 workstation outperform the MacBook Pro in multiple benchmark tests while running heavy workloads, it handled a sustained workload while maintaining a 12.8°F cooler temperature on the underside of its chassis. These findings indicate that the Precision 5680 workstation is an excellent option for individuals seeking to optimize their creative, design, and collaborative workflows.
How we tested
We compared two devices:
Dell Precision 5680 workstation:
Intel Core i9-13900H processor, with 14 cores
NVIDIA RTX 5000 Ada Laptop GPU
64 GB of RAM
4TB SSD
Apple MacBook Pro 16":
Apple M2 Max chip
12 core CPU, 38-core GPU, 16-core Neural Engine
64GB RAM
4TB SSD
To compare the performance of the Dell Precision 5680 workstation and the 16-inch Apple MacBook Pro, we conducted a series of benchmark tests, including:
Blender Benchmark
Geekbench 6
HandBrake
Cinebench R23
PugetBench
Topaz Video AI Benchmark
We also tested the performance of the devices while running a custom collaboration workflow and measured the temperature of the underside of the devices while running a demanding workload using the Cinebench R23 benchmark. For more details about the configurations and pricing of our test systems and our testing procedures, read the science behind the report.
What is benchmark testing?
Benchmark testing is a method of evaluating and comparing the performance of computers, components, or software. Consumers can use the results of benchmark tests to make informed purchasing decisions by comparing the relative performance of two or more systems while running specific workloads or completing certain tasks. To evaluate a system and provide objective measurements that are repeatable, benchmark tests offer a set of standardized tasks for a system to perform under controlled circumstances. For example, a video-editing benchmark test measures the performance of a device while running workloads that simulate real-world video-editing work. By comparing the video-editing benchmark test scores of devices, a consumer can get a better understanding of how the devices are likely to perform relative to one another while editing video.
About the Dell Precision 5680 workstation
The Dell Precision 5680 workstation is “built for work and design” and configurable with a wide range of powerful components.1 Buyers can select from Intel Core i5, i7, or i9 processors; a variety of high-powered graphics that can go up to NVIDIA RTX™ 5000 Ada class; multiple storage options up to 8TB (2x 4TB) NVMe® SSD; and a touch or non-touch display. The system we tested featured an Intel Core i9-13900H processor, an NVIDIA RTX 5000 Ada Laptop GPU, 64 GB of LPDDR5 memory, a 4TB NVMe SSD, and a touch display.
Different users need their devices to complete different tasks, so to evaluate the performance of the two systems, we conducted a series of benchmark tests that measure how well the systems process a variety of demanding workloads. In this section, we present the results of five performance benchmarks.
Blender
The Blender Benchmark measures 3D modeling performance using three different render models. The Precision 5680 workstation rendered up to 3.3x as many samples per minute as the MacBook Pro in the Monster and Classroom models and up to 3.1x as many samples per minute in the Junkshop model (Figures 3 through 5). This shows that users who carry out graphics-intensive workflows such as 3D rendering could finish projects faster and spend less time waiting for their systems with the Precision 5680 workstation.
Hypothetical scenario
Imagine a videographer—let’s call them Jonah—who is building a 3D product rendering for a video to celebrate a product release. Because rendering is so compute-intensive, he must wait for each export to complete. The higher Blender score of the Dell Precision 5680 means time savings for Jonah, which could allow him to produce an effective video to share the following day and make it home in time for dinner.
Blender benchmark samples per minute. We ran each test three times and report the median result. Higher is better. Source: Principled Technologies.
Blender benchmark samples per minute. We ran each test three times and report the median result. Higher is better. Source: Principled Technologies.
Blender benchmark samples per minute. We ran each test three times and report the median result. Higher is better. Source: Principled Technologies.
Geekbench 6 Compute OpenCL
The Geekbench 6 Compute OpenCL benchmark measures the performance of a computer’s GPU while running OpenCL (Open Computing Language) workloads. OpenCL is an open-source programming language that works across different platforms and devices. A higher Geekbench 6 Compute OpenCL benchmark score indicates better GPU performance, meaning the system can better handle complex computational tasks. The Precision 5680 workstation achieved a Geekbench 6 Compute OpenCL score that was up to 92.4% higher than the MacBook Pro (Figure 6). This could mean less downtime, more productivity, and finishing projects faster.
The Geekbench Compute OpenCL score of the devices. We ran each test three times and report the median result. Higher is better. Source: Principled Technologies.
HandBrake
Video encoding, essential for compressing video while maintaining quality, is one of the most resource- intensive processes for any system.2 Because it stresses CPU, memory, and GPU, it’s a helpful indicator of content creation performance. HandBrake is a popular platform for converting and encoding video. To measure video encoding performance with HandBrake, we used the HandBrake benchmark. This test measures the time to complete encoding and the number of FPS that devices process while encoding a predefined video. For our testing, we used a 2.1 GB, 5-minute MP4 video. The Precision 5680 workstation encoded 4K video in up to 15.4% less time than the MacBook Pro (Figure 5) and processed 22.5% more FPS than the MacBook Pro (Figure 6).
Hypothetical scenario
Say our videographer, Jonah, needed to encode 100 5-minute videos. Based on the time savings we saw in our testing, Jonah could save over 18 minutes by choosing the Precision 5680 workstation over the MacBook Pro.
Median average HandBrake hardware 4K H.265 video encoding times. We ran each test three times and report the median result. Lower is better. Source: Principled Technologies.
Median average HandBrake hardware 4K H.265 video encoding frames per second. We ran each test three times and report the HandBrake hardware 4K H.265 video encoding median result. Higher is better. Source: Principled Technologies.
Dell devices vs. Apple devices
Device configurability and software compatibility
Principled Technologies recently released a report that highlights some of the advantages of Dell devices compared to Apple devices. To learn more about our findings visit: https://facts.pt/xg909cK.
The ability to customize the device you purchase can mean you only pay for the performance and options that you need. Dell offers end users a broader selection of choices than Apple, such as:
More business laptop and mobile workstation models
More form factors
More storage, processor, and memory options
Multiple operating system options
Another benefit of choosing Dell devices is that not all business applications run natively on macOS. Dell Precision workstations have Independent Software Vendors-certification (ISVs) for many leading applications, so users don’t have to worry that leading applications will run on Dell ISV-certified devices.
Cinebench R23
Cinebench R23 evaluates a system’s hardware capabilities with CPU-intensive workloads such as those involving 3D graphics. It aims to test whether “a machine runs stable on a high CPU load” and whether “the cooling solution…is sufficient for longer running tasks to deliver the full potential of the CPU.”3 A higher Cinebench R23 score reflects better CPU performance, which could mean a smoother experience when rendering 3D graphics. When we measured the performance of the devices using the Cinebench R23 benchmark, the Precision 5680 workstation achieved a multi-core performance score that was up to 34.9% higher than that of the MacBook Pro, meaning the Precision 5680 workstation offers better performance running this type of CPU-intensive workload (Figure 8).
Cinebench R23 benchmark median scores. We ran each test three times and report the median result. Higher is better. Source: Principled Technologies.
Cinebench R23 benchmark median scores. We ran each test three times and report the median result. Higher is better. Source: Principled Technologies.
Hypothetical scenario
Thurston, an automotive design engineer, spends much of his work life generating complex, detailed 3D graphics. The higher Cinebench R23 multi-core score indicates that selecting the Precision 5680 workstation rather than the MacBook Pro could boost his productivity and reduce the frustration that comes with being forced to wait.
Adobe suite testing
PugetBench for Premiere Pro
The PugetBench for Premiere Pro benchmark evaluates a system’s performance completing various tasks using the video-editing application Adobe® Premiere® Pro. PugetBench measures a system’s performance while encoding to various codecs, processing different source media types, and creating common GPU effects using Adobe Premiere Pro. The benchmark uses these subscores to assign a system an overall score. When we compared the Adobe Premiere Pro performance of the two devices, we found that the Dell Precision 5680 workstation offered performance that was up to 6.4% higher than that of the Apple MacBook Pro (Figure 9).
PugetBench for Premiere Pro benchmark median overall scores. We ran each test three times and report the median result. Higher is better. Source: Principled Technologies.
PugetBench for Photoshop
The PugetBench for Photoshop benchmark evaluates a system’s performance completing various tasks using the photo-editing application Adobe Photoshop®. PugetBench for Photoshop measures a system’s performance while completing a broad range of common tasks in Adobe Photoshop and uses these subscores to assign a system an overall score. When we compared the Adobe Photoshop performance of the two devices, we found that the Dell Precision 5680 workstation offered performance that was up to 7.5% higher than the Apple MacBook Pro (Figure 10).
PugetBench for Photoshop benchmark median overall scores. We ran each test three times and report the median result. Higher is better. Source: Principled Technologies.
Hypothetical scenario
Jasmine, an advertising creative who spends her days using Photoshop and Premiere Pro. She moves fluidly from tool to tool as she makes progress on multiple projects in different stages, and the faster her system responds, the more her focus can stay on her work. The performance advantages the Dell Precision 5680 delivers on these tools can add up to hours of saved time, letting her finish projects faster, spend less time waiting for her system to respond, and do more of the creative work she enjoys.
Collaboration workflow testing
In a real-world setting, users might be in a Zoom meeting while using multiple applications to collaborate with their coworkers, which can put stress on a system. To measure the performance of the devices in such a scenario, we created a custom collaboration workflow and measured how long it took each device to complete predefined tasks in Outlook, PowerPoint, Google Chrome™, and Excel, while using Zoom. The Precision 5680 workstation completed the workflow in up to 2.8% less time than the MacBook Pro (Figure 11). For workers who spend countless hours collaborating with teammates, even a small advantage like this can add up over time.
The time it took the devices to perform a collaboration workflow using Zoom, in seconds. We ran each test three times and report the median result. Lower is better. Source: Principled Technologies.
Thermal testing
As remote and hybrid work have become more common, more users are using their laptops and workstations away from their desks. If you’re using your device in your lap, the temperature of the underside of the chassis can impact your comfort level. To assess how hot the devices might run while working hard, we ran a sustained Cinebench R23 workload consisting of five consecutive multi-core tests. As the workload was running, we measured the change in temperature of each device on the underside of its chassis. The Dell brand was notably cooler in this area than the Apple MacBook Pro, offering the possibility of a more comfortable user experience. It delivered this advantage while performing slightly better than the MacBook Pro on the Cinebench workload, meaning users don’t have to sacrifice their comfort to get a better performing device. For these results, read the science behind the report. With the Dell Precision 5680, a cooler laptop doesn’t come at a performance limitation.
Average change in temperatures under a sustained Cinebench R23 workload, in degrees Fahrenheit, on the underside of the devices we tested. Lower temperatures are better. Source: Principled Technologies.
Video AI testing
Video AI applications use algorithms to enhance the quality and resolution of videos. According to Topaz Labs, creators of Topaz Video AI, their video AI software “focuses solely on completing a few video enhancement tasks really well: deinterlacing, upscaling, and motion interpolation.”4The Topaz Video AI benchmark test evaluates the performance of systems while processing videos using Topaz Video AI. During the test, the benchmark measures the efficiency and speed of the systems as they process a standardized set of videos of different resolutions. The results of this benchmark test can help users understand how well a system will perform when using the Topaz Video AI software.
When we compared the video AI performance of the two systems using the Topaz Video AI benchmark, we found that the Dell Precision 5680 workstation offered 3.4x the performance of the MacBook Pro while converting 1080p video from 24 to 60 frames per second (FPS) and 3.1x the performance converting 4K video from 24 to 60 FPS. To put this in perspective, the Precision 5680 workstation might only need 30 minutes to convert a video clip that would take the MacBook Pro over an hour and a half.
The Topaz Video AI benchmark scores of the devices while running a Chronos workload on 1080p video. We ran each test three times and report the median result. Higher is better. Source: Principled Technologies.
The Topaz Video AI benchmark scores of the devices while running a Chronos workload on 4K video. We ran each test three times and report the median result. Higher is better. Source: Principled Technologies.
Audio quality testing
To compare the audio quality of the two systems, we conducted audio quality testing using a jury of three individuals. We played each participant three audio samples using the MacBook Pro and then played the same three audio samples using the Precision 5680 workstation. We then asked them about audio quality and which system’s audio they preferred. For more details about our audio quality testing and the questionnaire we gave participants, read the science behind the report.
The jury assessed the audio quality of the Precision 5680 workstation as being on par with the MacBook Pro. The first participant preferred the Precision 5680 workstation, the second participant preferred the Precision 5680 workstation for two thirds of the audio samples, and the third participant preferred the Apple system. In general, our participants found the Apple system to have more defined low-end sounds, which some perceived as muddier, while they found the Dell system to have clearer high-end sounds.
Conclusion
Whether you’re editing video, rendering 3D graphics, analyzing data, or collaborating with coworkers on a PowerPoint presentation, the performance of your device can impact how productive you are. When you’re catching up on emails on the couch or trying to put the finishing touches on a video project before boarding a flight, the temperature of the device in your lap can impact your comfort. Comparing a Dell Precision 5680 to a MacBook Pro 16", we found the Precision 5680 offered better performance running several demanding workloads, remained up to 12.8°F cooler under a sustained Cinebench workload, and offered comparable audio quality. Based on our tests, users who value performance and comfort should consider the Dell Precision 5680 workstation.
This project was commissioned by Dell Technologies.
September 2023
Principled Technologies is a registered trademark of Principled Technologies, Inc.
All other product names are the trademarks of their respective owners.
Principled Technologies disclaimer
Principled Technologies is a registered trademark of Principled Technologies, Inc. All other product names are the trademarks of their respective owners.
DISCLAIMER OF WARRANTIES; LIMITATION OF LIABILITY: Principled Technologies, Inc. has made reasonable efforts to ensure the accuracy and validity of its testing, however, Principled Technologies, Inc. specifically disclaims any warranty, expressed or implied, relating to the test results and analysis, their accuracy, completeness or quality, including any implied warranty of fitness for any particular purpose. All persons or entities relying on the results of any testing do so at their own risk, and agree that Principled Technologies, Inc., its employees and its subcontractors shall have no liability whatsoever from any claim of loss or damage on account of any alleged error or defect in any testing procedure or result.
In no event shall Principled Technologies, Inc. be liable for indirect, special, incidental, or consequential damages in connection with its testing, even if advised of the possibility of such damages. In no event shall Principled Technologies, Inc.’s liability, including for direct damages, exceed the amounts paid in connection with Principled Technologies, Inc.’s testing. Customer’s sole and exclusive remedies are as set forth herein.


 Twitter
 Facebook
 LinkedIn
 Email
Email