A Principled Technologies report: Hands-on testing. Real-world results.
Data proliferation and machine learning: The case for upgrading your servers to Dell PowerEdge R7625 servers powered by 4th Gen AMD EPYC processors
Principled Technologies examined the performance improvements and cost savings associated with upgrading to the 16th Generation Dell PowerEdge R7625 for machine learning algorithms
Overview
Recent years have seen a dramatic increase in the amount of data organizations store and analyze. Between 2010 and 2020, the amount of data people and organizations created, copied, consumed, and stored increased from 2 zettabytes to 64 zettabytes.1 Machine learning (ML) tools can help companies put this data to work by analyzing it and extracting key insights, enabling more informed, data-driven business decisions. To meet this need, ML tools have become more powerful—but these workloads also put more demand on data centers.
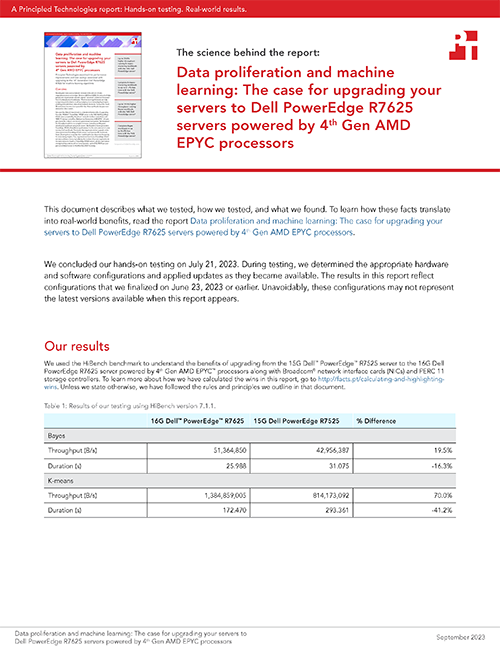
We used the HiBench benchmark to understand the benefits of upgrading from the 15G Dell™ PowerEdge™ R7525 server to the 16G Dell PowerEdge R7625 server powered by Broadcom® network interface cards (NICs) and PERC 11 storage controllers. Both servers feature two AMD EPYC™ 64-core processors for a direct core-to-core generational comparison. We measured the throughput and time to complete k-means clustering and Bayesian classification workloads using both servers. We found the latest-generation PowerEdge R7625 offered better performance for the same amount of cores running both workloads. This means that organizations that upgrade to the latest-generation PowerEdge R7625 servers could process ML workloads faster, allowing them to update their models with new data more frequently for more timely insights. Plus, organizations that choose PowerEdge R7625 servers could save money by reducing the number of servers required to do the same amount of work as PowerEdge R7525 servers, which could reduce energy/cooling costs as well as licensing costs—up to $10,178.99 per year per consolidated server on Red Hat OpenShift licensing.
The challenges of data proliferation and compute-intensive workloads
The rise of the Internet of Things (IoT), cloud computing, and smart phones have made it possible for businesses to harvest data from a wide range of sources and utilize it to improve their operations. Retailers can use data to track customer behavior and make their marketing more effective; manufacturers can use data to make their processes more efficient; and financial institutions can use data to detect fraud or predict market changes. As businesses gain access to new sources of data and use new technologies to analyze that data, the demand for more powerful servers will continue to grow.
Machine learning and artificial intelligence (AI) workloads have enormous potential to improve business operations, but as they gain popularity, they consume increasing amounts of processing power.2 According to OpenAI, developers of ChatGPT, the computing power of their AI system doubles every 3.4 month.3 As the ML applications organizations use become more demanding, they will need more powerful servers in their data centers as well as efficient data analysis tools in the ML pipeline. Among those data analysis tools is Apache Spark™.
Apache Spark is an open-source computing framework that converts very large data sets into smaller blocks of data for the purpose of applying machine learning algorithms and analyzing the data quickly using a distributed network of devices. For algorithms that operate on chunks of data, Spark is effective because it farms the data out to servers in the cluster, the servers process the chunks of data, and then Spark combines them for the final result. One of the main advantages of using Spark is that it can split data sets into chunks that fit in memory (when the entire data set might not) and operate with data that is entirely in memory—it doesn’t need to write to disk, which saves time. Spark is scalable: users can expand the size of their data set by adding more nodes. According to Databricks®, Spark can process “multiple petabytes of data on clusters of over 8,000 nodes,” and Spark supports a variety of data sources, including Hadoop HDFS.4
We focused on two Apache Spark capabilities—k-means clustering and Bayesian classification—in our examination of the value of upgrading to the 16G Dell EMC PowerEdge R7625 server powered by 4th Gen AMD EPYC processors along with Broadcom NICs and PERC 11 storage controllers. Using these workloads, we measured the throughput and speed of the servers. A server with better throughput and speed can process more data, handle more concurrent users, handle heavier workloads, and improve response times.
About Dell EMC PowerEdge R7625 servers
The Dell EMC PowerEdge R7625 server we tested features two AMD EPYC™ 9554 processors that each contain 64 cores and a Broadcom BCM5720 NIC. According to Dell, “the PowerEdge R7625 is a highly scalable two-socket, 2U rack server packed with 50 percent more cores and up to 6 GPUs in a package that combines powerful performance and flexible configuration.”5 According to Dell, the R7625 features:
“Up to two 4th Gen AMD EPYC processors with up to 96 cores
Available with either liquid or air-cooled configurations
One 16G Dell PowerEdge R7625 server powered by 4th Gen AMD EPYC 64-core processors along with Broadcom NICs and PERC 11 storage controllers
One 15G Dell PowerEdge R7525 server powered by 3rd Gen AMD EPYC 64-core processors along with Broadcom NICs and PERC 10 storage controllers
We configured both systems at maximum RDIMM capacity. The R7625 has a higher maximum capacity at 3TB and higher speed RAM at 4800 MT/s than the R7525 at 2TB and 3200MT/s, which is a useful upgrade for processing memory-intensive Spark workloads. We used Red Hat® OpenShift® virtualization. OpenShift is an open-source, Kubernetes-based container platform that offers a set of tools to manage, scale, and deploy containerized applications. For our deployment of OpenShift, we used a single-node deployment mode which is a new feature that is meant for proof of concept type environments. A typical OpenShift deployment uses three or more servers in a clustered configuration.
On each system, we created 10 OpenShift VMs with 24 cores, 96GB RAM, and one OpenShift VM with 12 cores, 32GB RAM, and one 30GB storage volume. We used this network for Spark cluster communications and Spark testing. We used Red Hat Enterprise Linux® 8 for the OS and installed Java™ 1.8.0, Python2®, and Apache Maven® 3.5.4; Apache Spark 3.0.3 with the Apache Hadoop 3.2 libraries; Apache Hadoop 3.2.4 for its HDFS capabilities; and the HiBench testing framework, version 7.1.1 with updates up to June 12, 2023 from its GitHub repository. We configured the 12-core VM as the Spark primary, and as the Hadoop manager for HDFS. We configured the remaining 10 VMs as Spark workers and Hadoop data nodes for HDFS. We used the storage volume for both the OS and for HDFS. We ran HiBench Bayes and k-means workloads from the Spark primary VM. Below is a table showing a summary of the system configurations we used in testing. For more details about our testing and configurations, read the science behind the report.
About 4th Gen AMD EPYC 9554 processors
According to AMD, EPYC 9554 processors deliver fast performance “for cloud, enterprise, and HPC workloads- helping accelerate your business.”7 EPYC processors include AMD Infinity Guard, which per AMD is “a set of layered, cutting-edge security features that help you protect sensitive data and avoid the costly downtime cause by security breaches.”8
The EPYC 9554 has support for AVX512 processor extensions that speed up AI inference, including the use of the BFloat 16 data type (AVX512_BF16), and Vector Neural Network Instructions (AVX512_VNNI). In contrast, the EPYC 7763 processor has no support for AVX512 instructions
In addition to performance and security features, AMD claims their processors are energy-efficient, which can reduce energy costs and “minimize environmental impacts from data center operations while advancing your company’s sustainability objectives.”9
Table 1: System configurations we used in testing. Source: Principled Technologies.
Server configuration information
Dell PowerEdge R7625
Dell PowerEdge R7525
Hardware
Processors
AMD EPYC 9554 – 64 cores,
3.10 GHz
AMD EPYC 7763 – 64 cores,
2.45 GHz
Storage controller
PERC H755 Front, 8GB cache
PERC H745 Front, 4GB cache
Total memory in system (GB)
3,072
2,048
Disks
4x Dell Ent NVMe v2 AGN MU U.2 6.4TB, 6,144GB, NVMe v2, PCle, SSD
4x Dell Ent NVMe v2 AGN MU U.2 6.4TB, 6,144GB, NVMe v2, PCle, SSD
Software
VM software
Spark 3.03 Hadoop 3.2.4 Open JDK 1.8.0_372
Operating system name and version
Red Hat Enterprise Linux CoreOS 4.12 Linux kernel 4.18.0-372.49.1.el8_6.x86_64
Virtualization
OpenShift Virtualization 4.12
VM operating system name and version
Red Hat Enterprise Linux 8.8 Linux kernel 4.18.0-477.13.1.el8_8.x86_64
Our results
K-means clustering
For large data sets, it isn’t possible for a human to analyze the data as efficiently or effectively as a machine learning algorithm can. K-means clustering is a machine learning algorithm that aims to group similar or dissimilar data points together in clusters. By finding similarities between data points that wouldn’t be obvious with other means of analysis, k-means clustering can unlock valuable insights into individual data points, whether they are about the customers of a business, the manufacturing processes of a factory, or some other aspect of a business. These insights could help an e-commerce company offer promotions to similar types of customers or help an insurance company detect anomalies or fraud. Using the latest generation of server technology has the potential to help businesses unlock these actionable data insights faster. Tools like RapidMiner®, ELKI, Orange, Weka®, and MATLAB™ rely on k-means clustering for some of types of calculations.
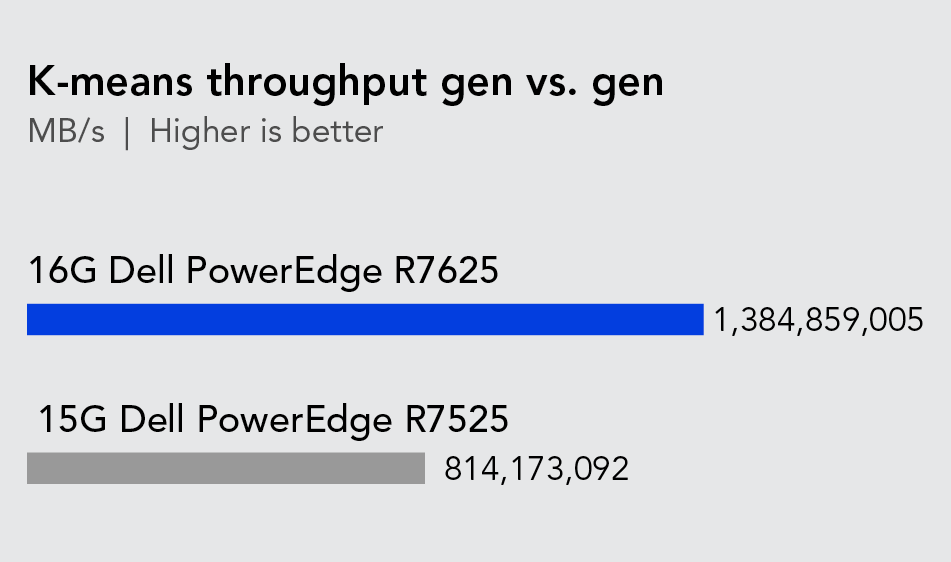
To better understand how upgrading server technology might benefit organizations that use k-means clustering to analyze their data, we used the HiBench benchmark suite to compare the k-means performance in terms of throughput (megabytes per second) and speed (seconds). As Figures 1 and 2 show, the new Dell PowerEdge R7625 server outperformed the previous-generation server in both measurements. The latest-generation server had 70.0 percent higher throughput and completed the k-means workload 41.2 percent faster than the previous-generation device.
These results suggest that organizations that frequently use k-means clustering to gain insights might benefit from upgrading their older servers. For an e-commerce company that provides personalized product recommendations to millions of users based on data, better throughput and faster k-means speed could allow them to tailor their recommendations more quickly. Faster throughput and speed could allow the e-commerce company to update their clustering model more frequently so that it adapts to changing customer behavior in real time. These improvements could lead to more customer engagement and higher sales.
A comparison of the k-means throughput of the two servers in megabytes per second. Higher is better. Source: Principled Technologies.
A comparison of the times, in seconds, that the two servers took to complete the test k-means workload. Lower is better. Source: Principled Technologies.
About the HiBench benchmark suite
According to its GitHub repository, the HiBench benchmark suite “is a big data benchmark suite that helps evaluate different big data frameworks in terms of speed, throughput and system resource utilizations.”10 The HiBench benchmark suite offers performance testing for 29 different types of workloads, including the machine learning algorithms associated with Bayesian Classification (Bayes) and k-means clustering.
Bayesian classification
Bayesian classification (or Bayesian inference) is a method of estimating the probability of an outcome and calculating the uncertainty around this probability using historical data. By analyzing prior outcomes, Bayesian machine learning can give organizations a statistical probability for a future outcome. A retailer may want to know the probability of a customer making a purchase after receiving a coupon code, for example. More advanced applications of Bayesian inference have helped scientists develop new drugs and assign probability to the accuracy of diagnostic tests.11,12 Being able to quickly analyze data sets for predictions about the future can be a powerful tool for businesses and organizations.
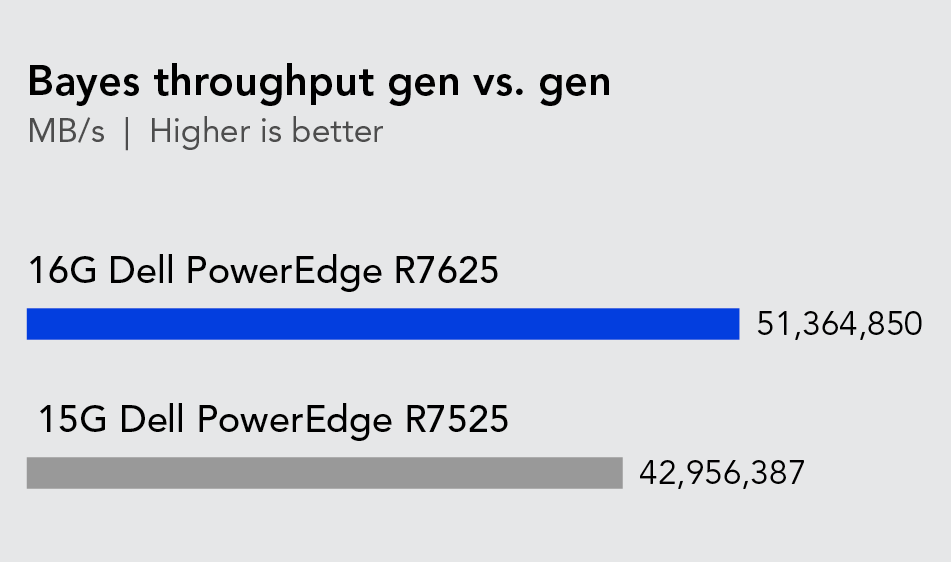
To evaluate the Bayesian analysis performance of the servers, we used the HiBench benchmark suite to compare the total throughput, measured in megabytes per second, and the speed of analysis, in seconds. As Figure 3 shows, the 16G Dell PowerEdge R7625 achieved 19.5 percent more throughput than the previous-generation server. As Figure 4 shows, the new server was 16.3 percent faster at completing the Bayesian classification workload than the previous-generation server we compared it to.
These results indicate just how much organizations that use Bayesian machine learning to make probabilistic calculations might benefit from upgrading their aging servers. For a financial services company that uses Bayesian analysis to make investment decisions and assess risk, higher throughput and speed could allow them to handle larger data sets and run more complex models to make more accurate, real-time decisions. Alternatively, a healthcare system that uses Bayesian models for diagnosis and treatment could update patient models faster and more frequently, leading to more accurate diagnosis and better health outcomes for patients.
A comparison of the Bayes throughput of the two servers in megabytes per second. Higher is better. Source: Principled Technologies.
A comparison of the times, in seconds, that the two servers took to complete the test Bayes workload. Lower is better. Source: Principled Technologies.
Performance and value – How these results can impact the bottom line
With any decision to upgrade a server environment, companies want to know that their upfront investment in new technology provides opportunities to save money further down the road. New technologies come at a price, but improvements in performance and efficiency can pay off in the long run.
Organizations can potentially save money by consolidating older servers with higher-performing, newer servers that each do more work. In our testing, a single Dell PowerEdge R7625 outperformed the Dell PowerEdge R7525 by up to 70 percent, completing 1.7 times as much k-means work as a single PowerEdge R7525. This means that two PowerEdge R7625 servers could process 3.4 times as much k-means work as one PowerEdge R7525 server. In other words, two PowerEdge R7625 servers can process the same amount of work as three PowerEdge R7525 servers with an additional 40 percent headroom. Thus, an organization that upgrades the servers in their data centers could likely reduce the total number of servers and still process the same workloads.
For each server a company can consolidate onto new gear, they can reduce their licensing cost for Red Hat OpenShift Platform Plus licensing costs for a standard 1-year subscription by $10,178.99 or by $27,820.99 for a standard 3-year subscription.16,17 These savings don’t even take into account premium subscriptions or additional support add-ons, which would further reduce annual licensing and support costs. By reducing server counts, companies could also find savings in the reduction of cooling costs, power costs, and data center footprints. As the number of servers in a data center scales, so too do the savings associated with upgrading to the latest-generation PowerEdge R7625 servers.
About Broadcom Gigabit Ethernet BCM5720 Controller
The Dell PowerEdge servers we tested feature Broadcom Gigabit Ethernet BCM5720 controllers. According to Broadcom, its 1G Ethernet Controllers are “the ideal solution for multicore servers, delivering full line-rate throughput across all ports.”13
The BCM5720 Dual-Port 1GBASE-T PCle 2.1 Ethernet Controller is a 13th generation 10/100/1000BASE-T and 10/100/1000BASE-X Ethernet LAN controller solution. The host interface supports a separate PCle function for each LAN interface and the controller includes I/O Virtualization (IOV) features such as 17 receive and 16 transmit queues, and 17 MSI-X vectors with flexible vector-to-queue association. These IOV features enable the BCM5720 to support the VMware® NetQueue and Microsoft VMQ technologies.14
Broadcom also states that this controller has “a comprehensive set of hardware features that the system may use to implement IEEE 1588 or IEEE 802.1AS-based time synchronization. These hardware features include a high-precision clock, timestamp registers for receive/transmit packets, and programmable trigger inputs and watchdog outputs.”15
The PERC11 series of adapters presents a diverse range of notable features. It ensures dependable, high-performance, and fault-tolerant management of the disk subsystem. These adapters possess extensive RAID control capabilities, offering support for multiple RAID levels, such as 0, 1, 5, 6, 10, 50, and 60.18 This facilitates efficient data safeguarding and redundancy mechanisms within the system.
Regarding compatibility, the PERC11 adapters conform to the Serial Attached SCSI (SAS) 3.0 standard, which facilitates a maximum data throughput of 12 Gb/s. This adherence ensures streamlined data transfer and seamless operations within the storage environment. Furthermore, the adapters boast extensive compatibility with a wide array of storage devices. They seamlessly integrate with Dell-qualified Serial Attached SCSI (SAS) and SATA hard drives, solid-state drives (SSDs), and PCle SSDs (NVMe). This versatility empowers users to leverage diverse storage options that align with their specific requirements and preferences.
Conclusion
As data proliferates and the sizes of databases grow, the potential to unlock valuable insights from them becomes increasingly dependent on fast architectures that can handle compute-intensive machine learning workloads such as k-means clustering and Bayesian inference. By upgrading to the latest servers, organizations can scale their processing power to meet the growing demands of their databases.
Larger databases and more powerful algorithms have the potential to give organizations a competitive edge. Faster servers can improve the accuracy of data-driven decisions by allowing organizations to use more complex algorithms and update ML models more frequently. To consider just two examples, improved performance could allow an e-commerce company to make better recommendations to customers and a financial services company to assess risks more accurately.
When we compared the machine learning performance of a 16G Dell PowerEdge R7625 server powered by 4th Gen AMD EPYC 64-core processors with Broadcom NICs and PERC 11 storage controllers to a previous-generation PowerEdge server, we found performance enhancements in terms of throughput and speed, whether running k-means clustering or Bayesian workloads. These findings suggest that organizations that rely on machine learning algorithms might gain performance advantages by upgrading to the latest generation of these Dell servers.
This project was commissioned by Dell Technologies.
September 2023
Principled Technologies is a registered trademark of Principled Technologies, Inc.
All other product names are the trademarks of their respective owners.
Principled Technologies disclaimer
Principled Technologies is a registered trademark of Principled Technologies, Inc. All other product names are the trademarks of their respective owners.
DISCLAIMER OF WARRANTIES; LIMITATION OF LIABILITY: Principled Technologies, Inc. has made reasonable efforts to ensure the accuracy and validity of its testing, however, Principled Technologies, Inc. specifically disclaims any warranty, expressed or implied, relating to the test results and analysis, their accuracy, completeness or quality, including any implied warranty of fitness for any particular purpose. All persons or entities relying on the results of any testing do so at their own risk, and agree that Principled Technologies, Inc., its employees and its subcontractors shall have no liability whatsoever from any claim of loss or damage on account of any alleged error or defect in any testing procedure or result.
In no event shall Principled Technologies, Inc. be liable for indirect, special, incidental, or consequential damages in connection with its testing, even if advised of the possibility of such damages. In no event shall Principled Technologies, Inc.’s liability, including for direct damages, exceed the amounts paid in connection with Principled Technologies, Inc.’s testing. Customer’s sole and exclusive remedies are as set forth herein.


 Twitter
 Facebook
 LinkedIn
 Email
Email