A Principled Technologies report: Hands-on testing. Real-world results.
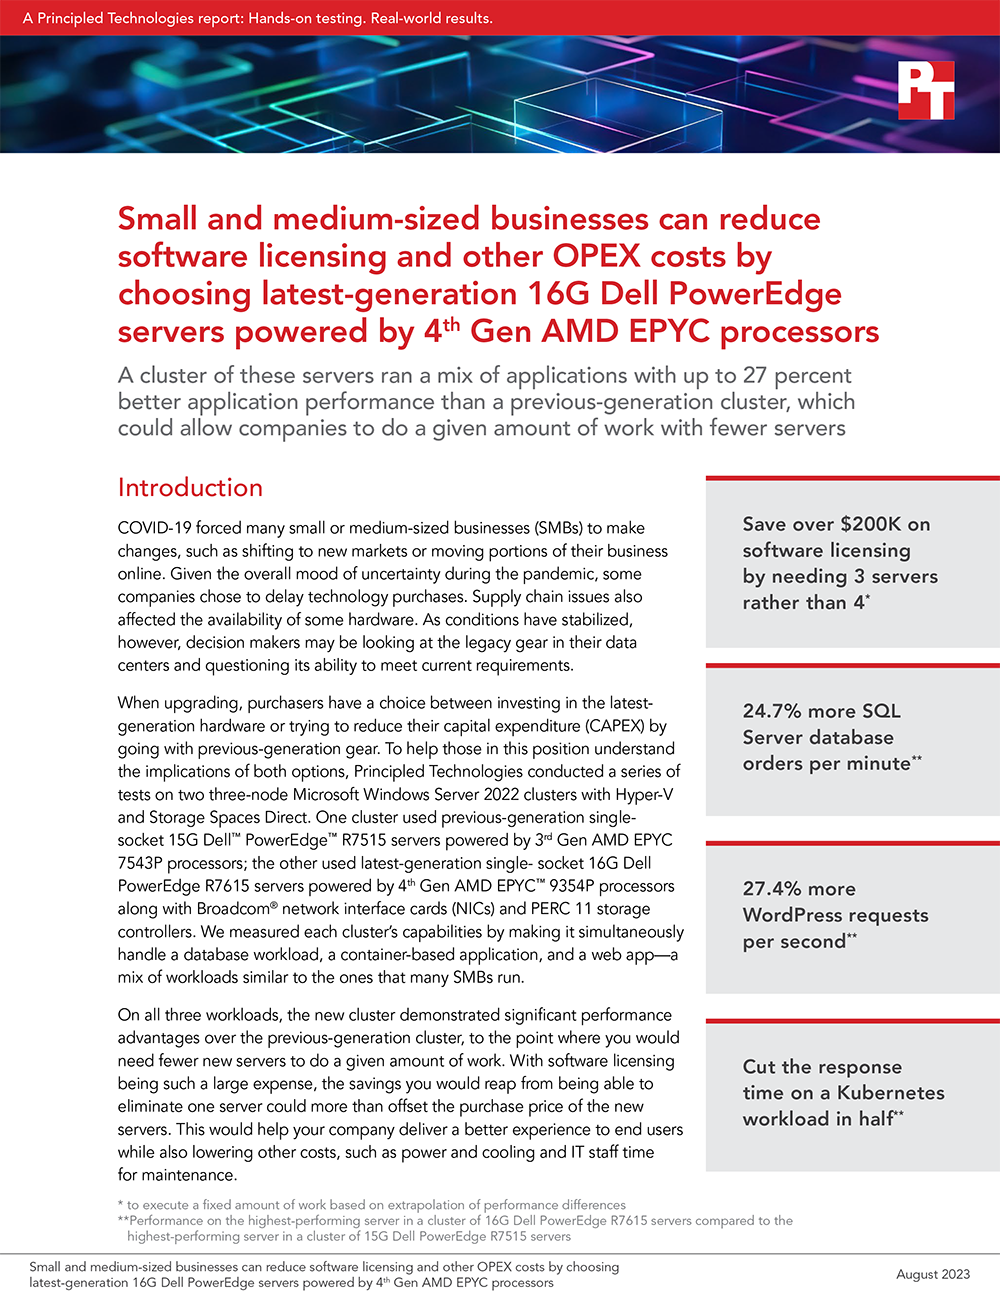
Small and medium-sized businesses can reduce software licensing and other OPEX costs by choosing latest-generation 16G Dell PowerEdge servers powered by 4th Gen AMD EPYC processors
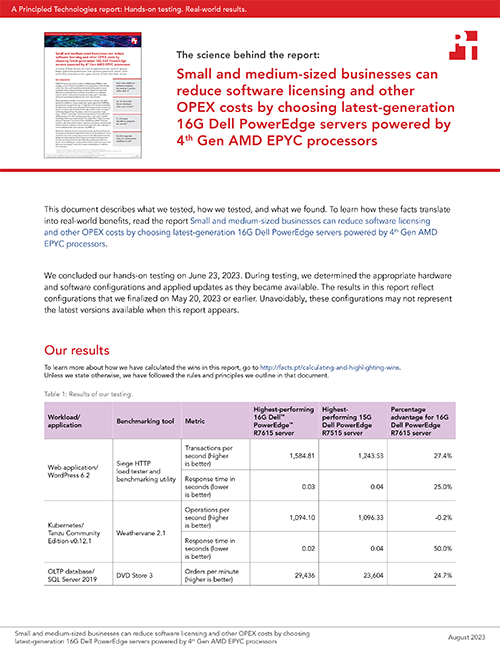
A cluster of these servers ran a mix of applications with up to 27 percent better application performance than a previous-generation cluster, which could allow companies to do a given amount of work with fewer servers
Introduction
COVID-19 forced many small or medium-sized businesses (SMBs) to make changes, such as shifting to new markets or moving portions of their business online. Given the overall mood of uncertainty during the pandemic, some companies chose to delay technology purchases. Supply chain issues also affected the availability of some hardware. As conditions have stabilized, however, decision makers may be looking at the legacy gear in their data centers and questioning its ability to meet current requirements.
When upgrading, purchasers have a choice between investing in the latest-generation hardware or trying to reduce their capital expenditure (CAPEX) by going with previous-generation gear. To help those in this position understand the implications of both options, Principled Technologies conducted a series of tests on two three-node Microsoft Windows Server 2022 clusters with Hyper-V and Storage Spaces Direct. One cluster used previous-generation single-socket 15G Dell™ PowerEdge™ R7515 servers powered by 3rd Gen AMD EPYC 7543P processors; the other used latest-generation single- socket 16G Dell PowerEdge R7615 servers powered by 4th Gen AMD EPYC™ 9354P processors along with Broadcom® network interface cards (NICs) and PERC 11 storage controllers. We measured each cluster’s capabilities by making it simultaneously handle a database workload, a container-based application, and a web app—a mix of workloads similar to the ones that many SMBs run.
On all three workloads, the new cluster demonstrated significant performance advantages over the previous-generation cluster, to the point where you would need fewer new servers to do a given amount of work. With software licensing being such a large expense, the savings you would reap from being able to eliminate one server could more than offset the purchase price of the new servers. This would help your company deliver a better experience to end users while also lowering other costs, such as power and cooling and IT staff time for maintenance.
Considerations SMBs face when upgrading IT infrastructure
When preparing to replace their outdated servers with modern ones, small and medium-sized businesses face a wide range of challenges, but three common ones are cost, staffing, and equipment longevity.
IT budgets are limited, and it can be easy to underestimate the true cost of new gear if decision makers account for only the CAPEX of the hardware purchase. Companies should also consider the ongoing operating expenditures (OPEX) involved with servers, such as rack space and power for servers, IT staffing resources, and the most expensive item: software licensing.
Researching technology solutions, deploying servers, and providing support once the new equipment is up and running can all be extremely time-consuming tasks. By choosing a solution that minimizes these IT burdens, companies can free their in-house admin teams to take care of other needs or limit costs for third-party IT.
Choosing a server solution that is a good fit for the unique needs of your business can feel like walking a tightrope. On the one hand, you want to avoid overinvesting in technologies with capabilities that exceed the requirements of your workloads. On the other hand, underinvesting can also be a mistake, leaving you with servers that lack the power and reliability necessary for mission-critical workloads for the lifespan of the new equipment, cannot handle future growth well, and risk delivering an unsatisfactory experience to both customers and employees. An underpowered solution could have a shorter lifecycle, which would put you back at square one of the decision-making process sooner. Perhaps the greatest downside to choosing a previous-generation solution is that doing so can require you to purchase operating system and application software licenses for an additional server.
All these considerations make it very important to take time to assess your current and future needs, such as the types of workloads you run, the number of customers and employees you support, and the growth you anticipate. By doing so, you greatly improve the likelihood of selecting a cost-effective hardware solution that will suit your needs for the life span you hope the solution to have.
The limitations of cloud
Before we dive into data center upgrades, we must consider the cloud. While many companies have shifted business applications to the cloud, there are potential disadvantages and limitations, which you should weigh against the convenience of this approach. These include security concerns, dependence on the internet, lack of control of resources, occasional downtime, vendor compatibility, and cost.
Security concerns
While cloud service providers (CSPs) typically apply multiple security measures to keep their cloud infrastructure safe from attack, data breaches do occur. For instance, a 2021 flaw in the Microsoft Azure Cosmos DB database resulted in customer information being exposed to hackers.1 While threats such as this one do not make cloud computing entirely insecure, they demonstrate “a higher chance of successful attacks or data breaches when there is human error in cloud setup and issues with endpoint configurations.”2
Limited flexibility and control over resources
Cloud providers typically do not allow business owners to manage and monitor the hardware in their cloud environment. This limits the visibility into potential future problems or hardware failures, leaving the business completely reliant on the cloud provider’s planning and reliability. CSPs can also place limits on the tools, applications, and data that customers can deploy on cloud servers.3
Occasional downtime
When cloud servers go down, forcing users to wait until a connection is restored, businesses can lose customers and revenue.4 One example of downtime affecting cloud-based businesses was the hour-long 2020 blackout of all Google services.5 This type of downtime may be rare, but it can have an enormous negative impact.
Vendor compatibility issues
Transitioning from one CSP to another is not necessarily a seamless experience. Applications working properly in one cloud platform will not always be compatible with another provider’s platform, a risk that can make decision makers feel “locked in” with a single provider.6
Cost
A company’s monthly CSP bill increases along with usage, making cloud potentially very expensive. As Wang and Casado outline in the Andreesen Horowitz paper “The Cost of Cloud, a Trillion Dollar Paradox, ”paying a “flexibility tax” for the public cloud often makes good business sense early in a company’s journey, but can lead to large OPEX outlays that can offset the flexibility benefits.7
One company that left the cloud for economic reasons was project management platform Basecamp. In October 2022, Basecamp CTO David Heinemeier Hansson wrote, “Renting computers is (mostly) a bad deal for medium-sized companies like ours with stable growth. The savings promised in reduced complexity never materialized.”8
A look at the applications SMBs are running in their data centers
These downsides of the cloud are some of the reasons decision makers run certain applications in their data centers. Another reason is the nature of the applications themselves. For example, companies may choose to keep internal applications such as company portals and human resources applications on servers that are on site. We tested with three types of applications companies might place on on-site servers.
Kubernetes containers for containerized apps
A container is a unit of software packaged with everything required to run that software in a standalone state, including binaries, libraries, dependencies, and of course, the application itself. Kubernetes® is an open-source platform for deploying and managing applications that run in containerized environments.
Organizations deploy applications in Kubernetes containers for scalability and flexibility; containers also give them the ability to burst to cloud when necessary. Thanks to software improvements, Kubernetes technology has become more accessible in recent years. Running your containerized applications on high-performing servers is a win because the smaller footprint of containerized applications lets you take better advantage of the increased resources of those servers.
Kubernetes containerized environments can allow organizations to offer a high-quality user experience for multi-tiered web applications, such as those for online auctions and ecommerce.
WordPress for websites
Websites are a critical resource for many small and medium-sized businesses, and WordPress is an extremely popular web platform for businesses of all shapes and sizes. According to WordPress, “More bloggers, small businesses, and Fortune 500 companies use WordPress than all other options combined.”9 Almost as important as having a website is having it perform well in terms of speed and responsiveness. For example, if your site takes more than 3 seconds to load, 40 percent of potential customers will abandon it.10
The WordPress platform provides a way for companies to have a web presence, which is obviously a vital component of success because web searches may well be the way most customers will find businesses. Because users expect web pages to load quickly and have little patience when they fail to do so, strong WordPress performance can translate to attracting and keeping customers, while poor WordPress performance can cause you to lose customers before they even see your site.
Online transaction processing (OLTP) databases that underlie many critical business applications
For SMBs, OLTP databases are essential tools for organizing and tracking customers, inventory, employees, and finances. Examples of OLTP databases include:
Customer relationship management (CRM) databases maintain all the information about accounts, contacts, leads, and opportunities. The record for an individual customer might track not only contact information and order history, but also details of service calls and more. Companies can also use CRM databases to manage marketing and promotions, export email addresses, and generate shipping labels.11
Inventory tracking databases help companies keep tabs on how much inventory they have and where it is located. The database can include integrated bar codes and scanners that employees can use to track and monitor items as they travel from one location to another, and can send alerts when supplies of critical items are running low.12
Payroll and scheduling databases keep track of employee data, such as wages, accrued vacation time, and benefits.13
One such OLTP database application is Microsoft SQL Server, a widely recognized relational database management system (RDBMS) that utilizes the SQL programming language. At the center of its architecture is the Database Engine, a relational engine for query processing and a storage engine for database file and index management. It also includes other data-related services such as SQL Server Integration Services (SSIS), SQL Server Analysis Services (SSAS), and SQL Server Reporting Services (SSRS).
For those running these and other SMB database applications, performance is an important element of effectiveness. Servers that deliver database results quickly mean less waiting and frustration for your employees as they perform their jobs, and putting important information into the hands of decision makers sooner.
Testing this mixed, multi-application workload
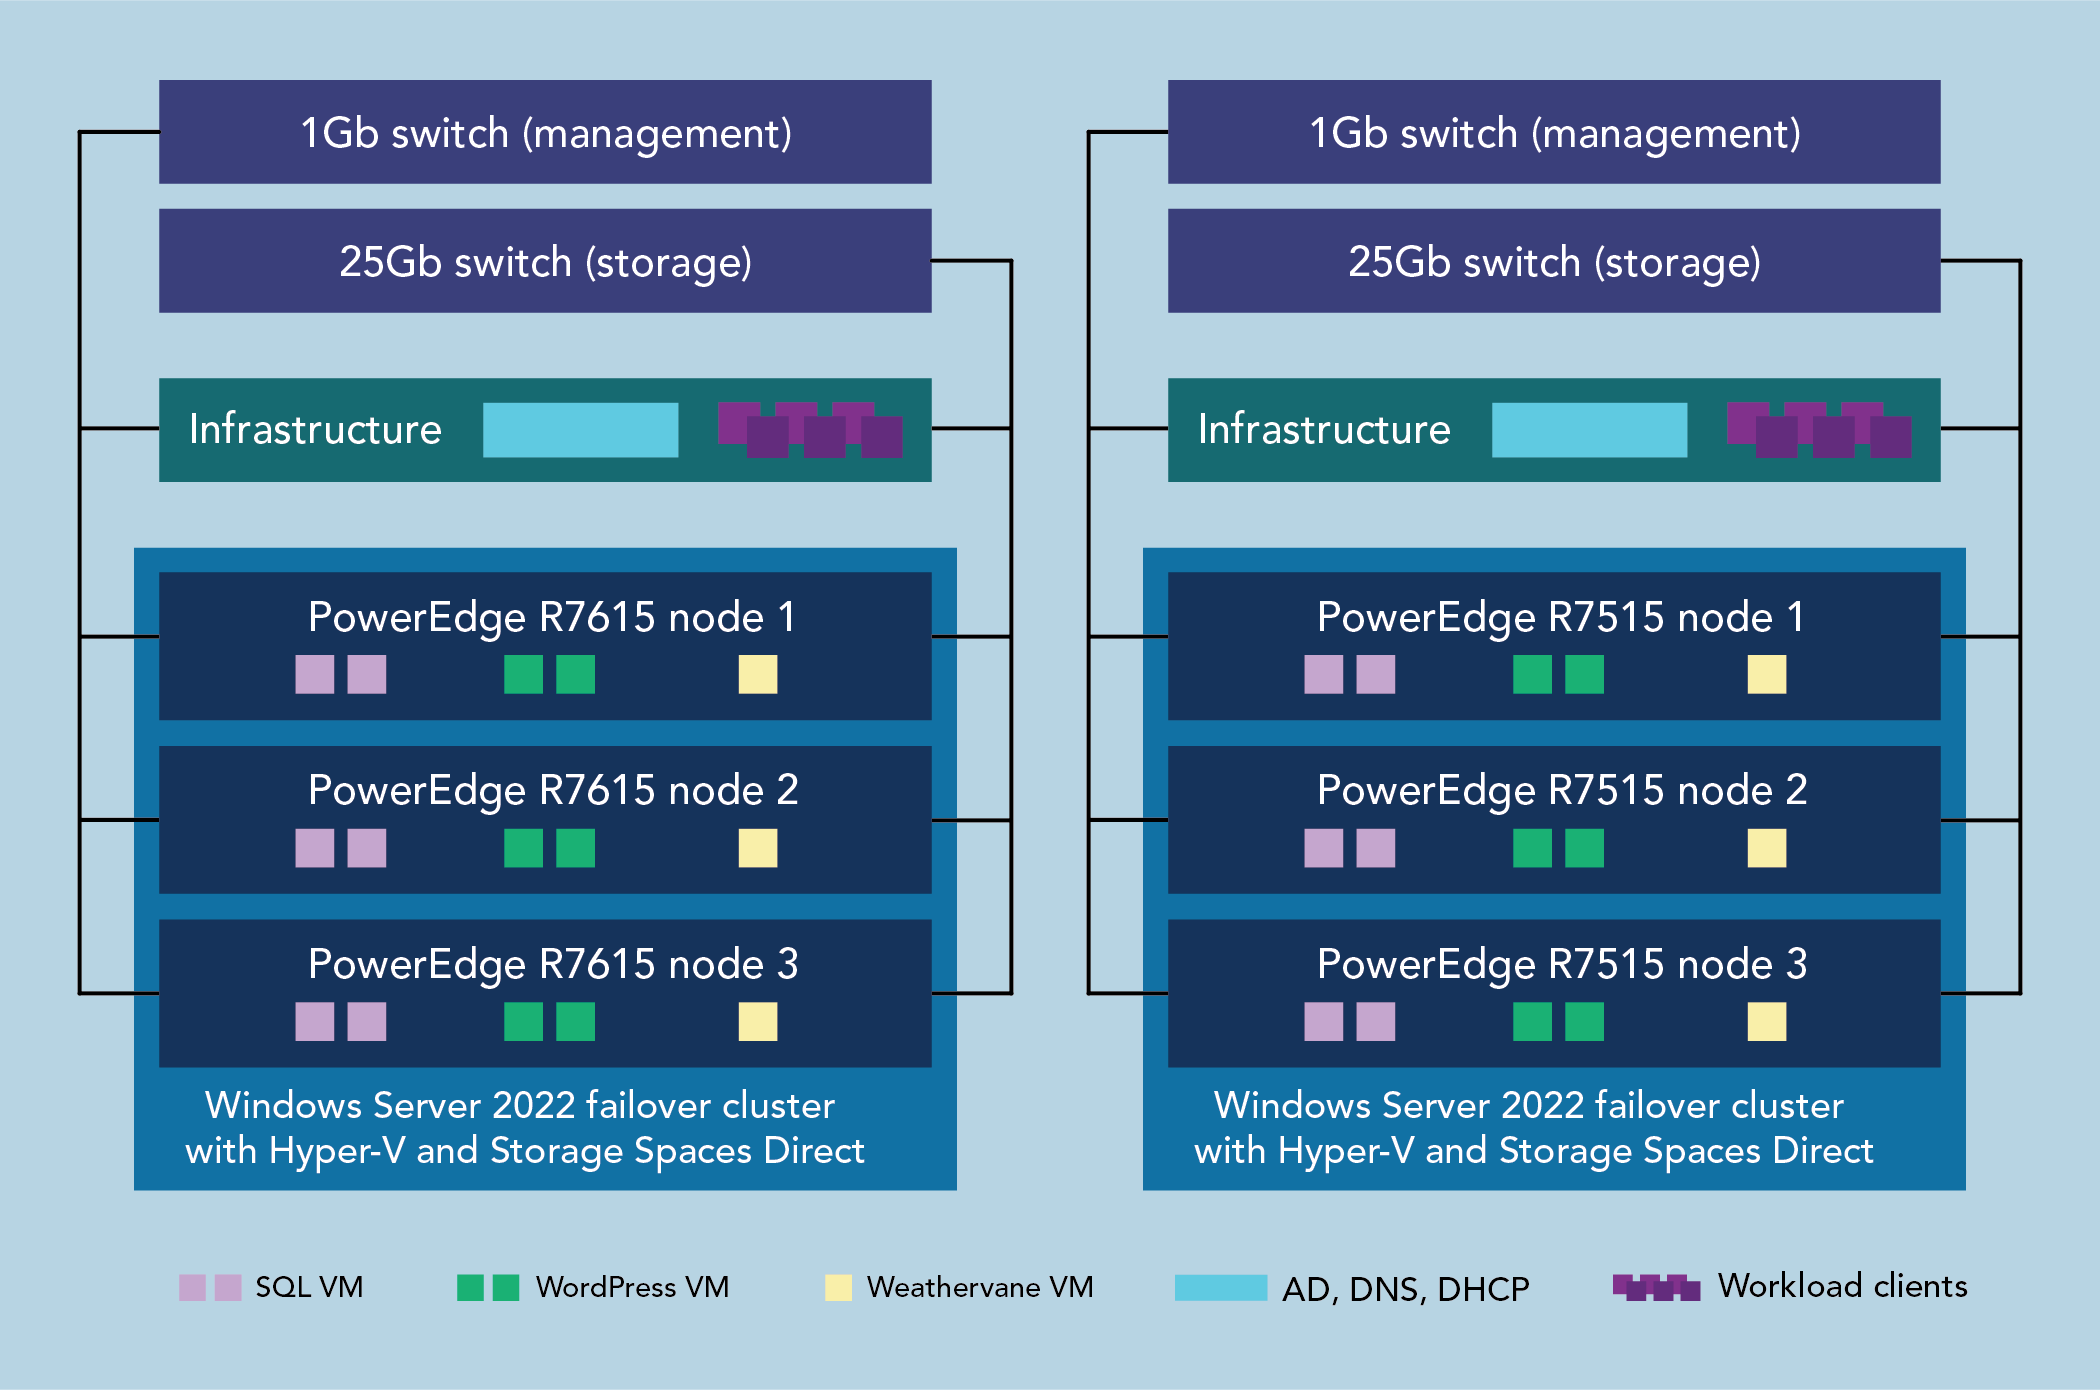
To help small and medium-sized businesses considering upgrading their legacy servers, we conducted testing using two different three-node Microsoft Windows Server 2022 clusters with Hyper-V and Storage Spaces Direct:
One using previous-generation single-socket 15G Dell PowerEdge R7515 servers with 3rd Gen AMD EPYC processors
One using current-generation 2U, single-socket 16G Dell PowerEdge R7615 servers powered by 4th Gen AMD EPYC processors along with Broadcom NICs and PERC11 storage controllers
We chose the PowerEdge R7615 for a number of reasons. As a 2U rack server, it offers better storage options than a 1U server. The fact that it uses single-socket processors provides a financial advantage over multi-socket servers in terms of both its purchase price and its licensing requirements. Any software that uses a per-socket licensing structure will be less expensive to license. We configured the PowerEdge R7615 servers with PERC11 storage controllers because of their effect on both redundancy and performance. We selected 16G servers with AMD EPYC 9354P processors because they strike a balance between strong performance and optimized cost and because 32 cores is a sweet spot for licensing. The 9354P is also less expensive than the two-socket 9354 version of the processor.14
Our mixed workload included a Microsoft SQL Server database component, a multi-tier web app (Weathervane) on Kubernetes, and a WordPress component. All applications ran simultaneously to simulate an organization using a single cluster of three servers to run multiple concurrent applications.
Table 1 shows the server hardware we used, Table 2 shows the software we used, and Figure 1 shows a diagram of our test bed. Note that given the differences in memory channel architecture between the two server generations, we could not match the RAM capacities while also configuring the systems in a balanced, optimized configuration. We chose to ensure a balanced configuration to optimize for performance. As a result, the 16G servers had a greater memory capacity than the 15G servers.
Broadcom 57414 Dual Port 10/25GbE SFP28, OCP NIC 3.0
Broadcom Gigabit Ethernet BCM5720 2x 1Gb Ethernet
Broadcom 57414 Dual Port 10/25GbE SFP28, OCP NIC 3.0
Total memory in system (GB)
192
128
Host operating system name and version/build number
Microsoft Windows Server 2022 Datacenter Version 10.0.20348 Build 20348
Table 2: Software we used.
Workload
Application
VM operating system
Benchmarking tool
OLTP database
SQL Server 2019
Microsoft Windows Server 2022 Datacenter
DVD Store 3
Kubernetes
Tanzu Community Edition v0.12.1
Ubuntu 22.04
Weathervane 2.1
Web application
WordPress 6.2
Ubuntu 20.04
Siege HTTP load tester and benchmarking utility
About Dell PowerEdge R7615 servers
The Dell PowerEdge R7615 is a 2U, single-socket rack server. Dell states that it has designed this server to provide “performance and flexible, low-latency storage options in an air or Direct Liquid Cooling (DLC) configuration.”15
According to Dell, this server uses the AMD EPYC 4th generation processor to deliver up to 50 percent higher core count per single-socket platform in an innovative air-cooled chassis and supports DDR5 at 4800 MT/s memory and PCIe® Gen5 with double the speed of previous Gen4 for faster access and transport of data, optimizing application output.16 It supports up to six single-wide full-length GPUs or three double-wide full-length GPUs to improve responsiveness or reduce app load time for power users and supports lower-latency, high-performance NVMe SSDs in a hardware RAID solution to help maximize compute performance.17
Test bed diagram. Source: Principled Technologies.
SQL Server with DVD Store workload
We conducted a series of tests on an OLTP workload that we set up using the DVD Store 3 benchmarking tool.18 DVD Store, an open-source test and benchmark tool, emulates an online store specializing in DVD sales. The test utility simulates customers logging in, browsing products by title or author, accessing reviews, submitting new reviews, rating existing reviews, signing up for premium membership, and making purchases.
To gauge performance, the benchmarking tool generates a metric of orders placed per minute. For our testing, we generated a pre-sized database elsewhere, then restored that database backup in our environment for testing.
About AMD EPYC 9354P processors
Part of the Platform Server Product Family and the AMD EPYC 9004 Series, these 32-core, 64-thread processors have a maximum boost clock of 3.8GHz, an all-core boost speed of 3.75GHz, a base clock of 3.25GHz, and a 256MB L3 cache.19 These are the single-socket versions of the 64-core processors that are cost optimized for single-socket servers.
According to VMware, “Weathervane 2.1 is an application-level performance benchmark which lets users investigate the performance characteristics of on-premises and cloud-based Kubernetes clusters… by deploying one or more applications on the cluster and then driving a load against those applications.”20 Weathervane uses a multi-tier web application that includes both stateless and stateful services. The Weathervane benchmark provides a variety of pre-tuned configurations (i.e., deployment sizes) for the app, allowing users to select a configuration appropriate for their cluster sizing. The Weathervane workload driver generates the load and runs on a Kubernetes cluster. Users can configure Weathervane “to generate a steady load using a fixed number of simulated users, or to automatically vary the number of users to find the maximum number that can be supported on the cluster without violating quality-of-service (QoS) requirements.”21
In the fixed-load scenario, Weathervane gives the test a passing score only if the run completes without violating the QoS requirements. In the maximum-user scenario, Weathervane reports the highest number of simulated users that completed the test without violating the QoS requirements. Weathervane refers to this number as the peak WvUsers. In our testing, we used the fixed-load scenario to allow us more control over system resource utilization while running our three different workloads. We ran one Kubernetes cluster using Docker on one VM per node for a total of three Kubernetes clusters per physical cluster. We then deployed an instance of the Weathervane workload to each Kubernetes cluster.
WordPress with Siege benchmark
Siege is an open-source HTTP load testing benchmark utility designed to measure a website or multiple websites performance under stress. It can test a single URL with a set number of simulated users, or can read multiple URLs into memory and stress them simultaneously.22 According to the Siege GitHub page, “Siege supports HTTP/1.0 and 1.1 protocols, the GET and POST directives, cookies, transaction logging, and basic authentication. Its features are configurable on a per user basis.”23
In our testing, we used Siege to target a default WordPress install on Ubuntu 20.04. We ran the test for 30 minutes and report the average transactions per second.
Our test configuration
We configured each cluster with the same number of VMs:
Six OLTP (SQL Server) VMs, with two on each physical node
Six WordPress VMs, with two on each physical node
Three Weathervane VMs, with one on each physical node. Each of the three VMs ran containers in a single Kubernetes cluster, with a single Weathervane instance targeting that Kubernetes cluster.
We sized the VM memory to mostly fill the host capacity (192 GB and 128 GB for the 16G server and the 15G server, respectively). Table 3 provides details of our test configuration.
Table 3: Details of our test configuration.
Workload VM number and type on each node
Number of vCPUs per VM
Memory per VM (MB)
Virtual hard disk number and size per VM
16G Dell PowerEdge R7615
2x SQL Server
10
28,672
1x 140 GB OS 1x 140 GB DB 1x 40 GB log
1x Weathervane
16
61,440
1x 256 GB
2x WordPress
10
28,672
1x 48 GB
15G Dell PowerEdge R7515
2x SQL Server
10
16,384
1x 140 GB OS 1x 140 GB DB 1x 40 GB log
1x Weathervane
16
40,960
1x 256 GB
2x WordPress
10
16,384
1x 48 GB
We ran the following parameters:
Database (DVD Store 3)
16 threads
5ms think time
30s run time
24s warmup time
10 users per second ramp rate
WordPress
25 users per VM
0ms think time
Weathervane
2,500 users per VM
About Broadcom PERC11 PERC H755N controllers
The PERC11 series of adapters presents a diverse range of notable features. To begin with, it ensures dependable, high-performance, and fault-tolerant management of the disk subsystem. These adapters possess extensive RAID control capabilities, offering support for multiple RAID levels, such as 0, 1, 5, 6, 10, 50, and 60.24This facilitates efficient data safeguarding and redundancy mechanisms within the system.
Regarding compatibility, the PERC11 adapters conform to the Serial Attached SCSI (SAS) 3.0 standard, which facilitates a maximum data throughput of 12 Gb/sec. This adherence ensures streamlined data transfer and seamless operations within the storage environment. Furthermore, the adapters boast extensive compatibility with a wide array of storage devices. They seamlessly integrate with Dell-qualified Serial Attached SCSI (SAS) and SATA hard drives, solid-state drives (SSDs), and PCIe SSDs (NVMe).25 This versatility empowers users to leverage diverse storage options that align with their specific requirements and preferences.
What testing revealed
In the sections below, we present the findings of the three workloads we ran simultaneously on our two clusters, each of which comprised three servers. We identified the highest-performing server in each cluster and present the results that server achieved on each of our three workloads.
Kubernetes/Weathervane
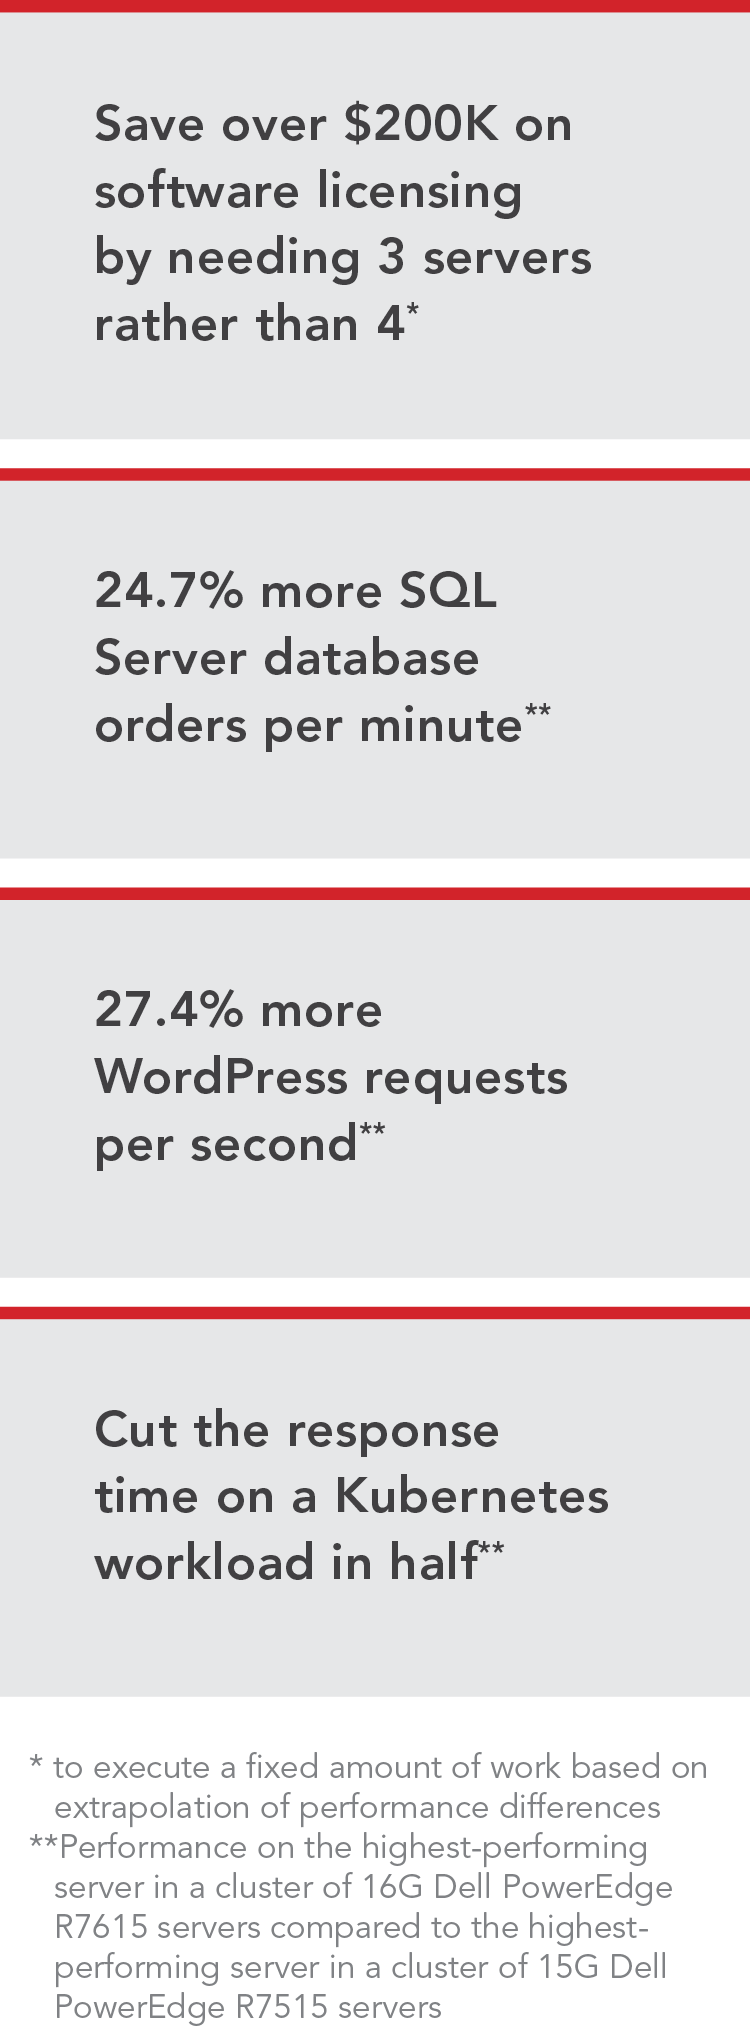
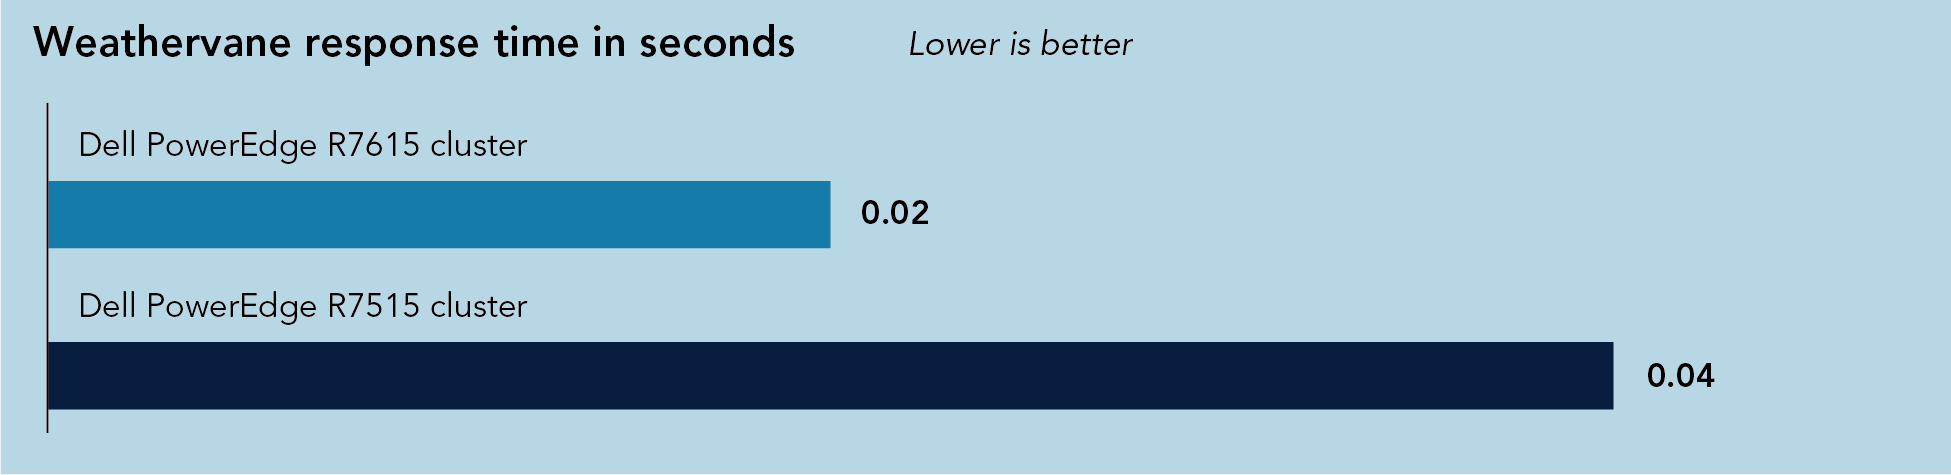
As we noted earlier, our Weathervane testing consisted of a fixed-user scenario with the same number of WvUsers on both clusters. With an almost identical throughput rate, response time on the highest-performing new Dell PowerEdge R7615 server was half that of the highest-performing previous-generation Dell PowerEdge R7515 server (see Figure 2). This performance advantage could translate to higher numbers of supported users, or lower latencies for a fixed set of users, improving user experience due to reduced response time while interacting with the site.
We identified the response time from the single Weathervane application on the best-performing server and present that time here.
Weathervane response time on the highest-performing server in each cluster. Lower is better. Source: Principled Technologies.
WordPress/Siege
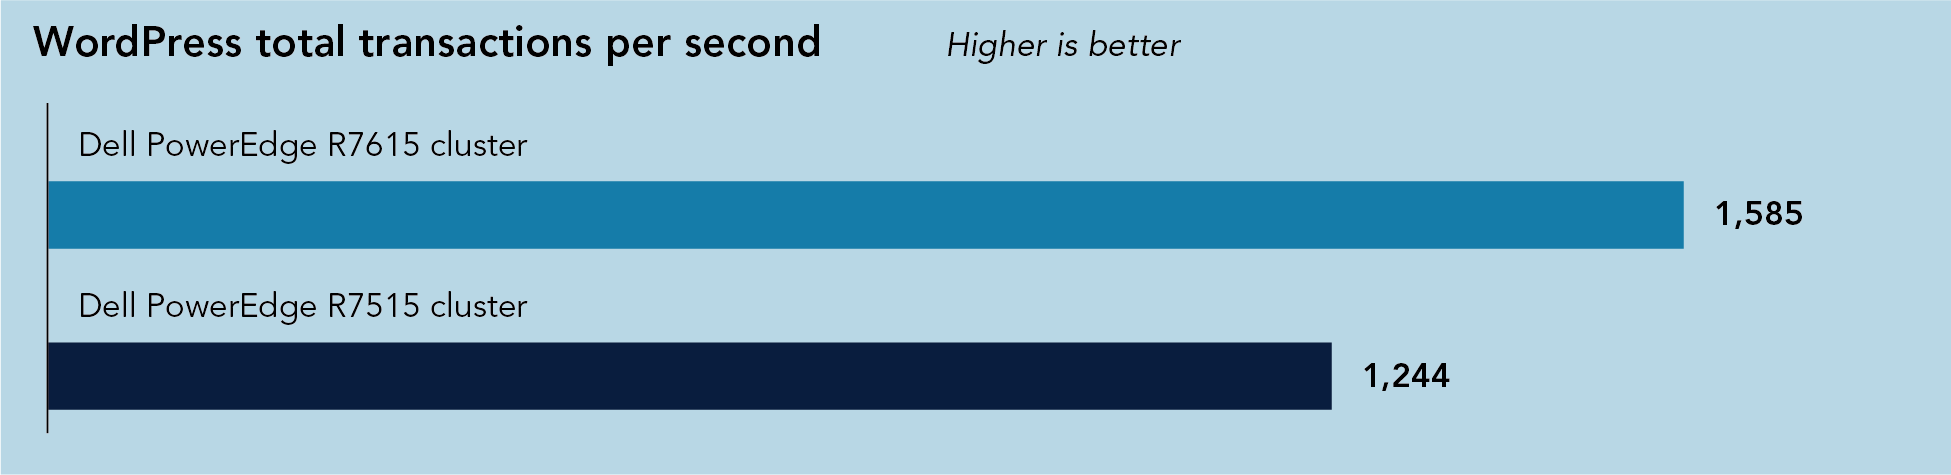
After we ran the Siege benchmark to measure WordPress performance, we added the transactions per second from the two VMs on the best-performing server in each cluster and present those sums here.
As Figure 3 shows, the highest-performing server in the cluster of new Dell PowerEdge R7615 servers achieved a rate of WordPress requests per second that was 27.4 percent higher than that of the highest-performing server in the previous-generation cluster. This performance advantage could translate to speedier load times, which would position your business much better in the competitive landscape where “88% of online users won’t return to a site after a bad experience.”26
Total WordPress transactions per second on the highest-performing server in each cluster. Higher is better. Source: Principled Technologies.
SQL Server/DVD Store 3
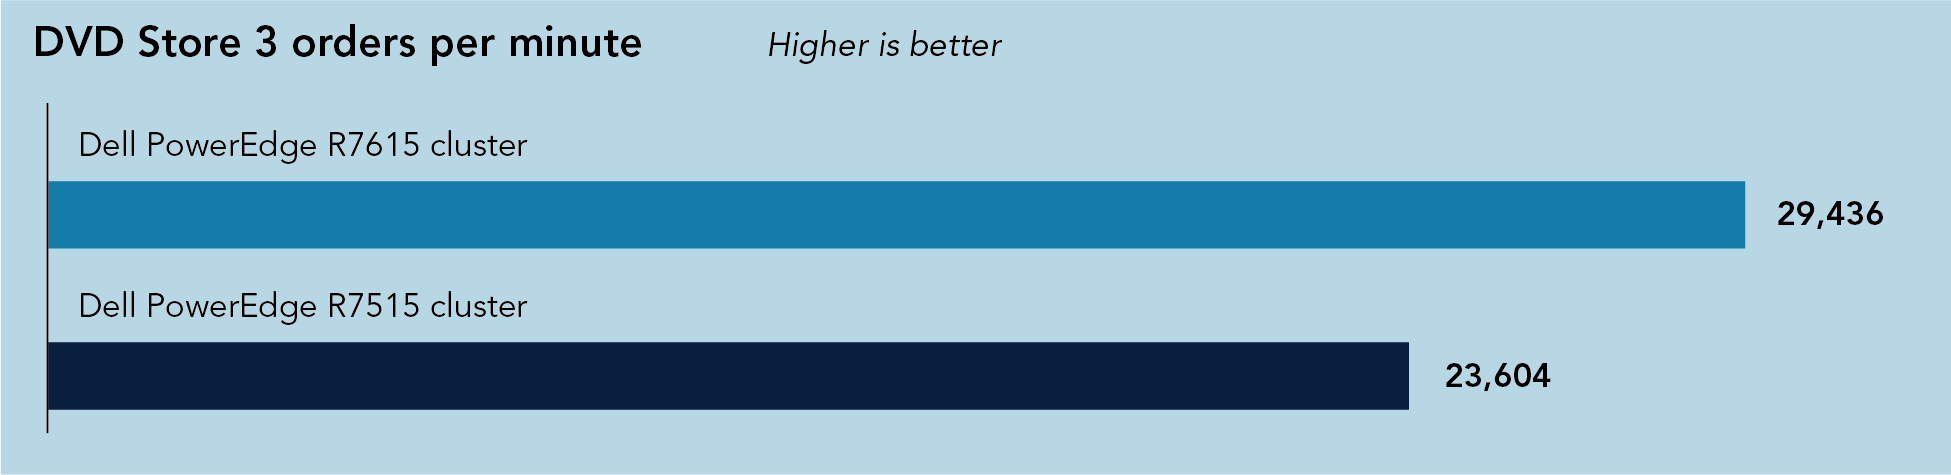
After we ran the DVD Store 3 benchmark to measure SQL Server database performance, we added the orders per minute from the two VMs on the best-performing server in each cluster and present those sums here.
As Figure 4 shows, the highest-performing server in the cluster of new Dell PowerEdge R7615 servers achieved a rate of OPM that was 24.7 percent higher than that of the highest-performing server in the previous-generation cluster. This performance advantage could translate to speedier and more responsive behavior on the part of many business database applications, such as those we noted earlier—customer relationship management, inventory, and business data analysis.
Total DVD Store 3 transactions per second on the highest-performing server in each cluster. Higher is better. Source: Principled Technologies.
Why was performance on the new Dell PowerEdge R7615 cluster better?
Any time you undertake a system upgrade such as the one in our test scenario, multiple factors work together to improve performance. In our testing, we saw clear advantages of the Dell PowerEdge R7615 with Dell PowerEdge RAID Controller 11 cluster on the mixed workload we tested. We can attribute a portion of this improvement to this solution’s use of latest 4th Gen AMD EPYC processors, which have a base CPU frequency of 3.25 GHz and support up to 4800 MT/s DDR5 RAM, a considerable improvement over the 2.80 GHz base CPU frequency and 3200 MT/s DDR4 RAM of the older AMD EPYC processors in the previous-generation servers. If we compare the SPEC®2017 test results for the Dell PowerEdge R7515 and Dell PowerEdge R7615 with the same processors our test servers used, we see increases ranging from 33 percent on Integer Base to 66 percent on Floating Point Base.27
In addition to its more powerful processor, the Dell PowerEdge R7615 also has faster and more RAM with DDR5 and supports 24Gbps SAS storage. (Note that both solutions used the same SAS storage drives, which are rated for 24Gbps SAS data transfer speeds. However, the previous-generation PowerEdge R7515 supported only up 12Gbps SAS, while the PowerEdge R7615 could run at the full 24Gbps rate.)
Spotlight on licensing costs
While increased performance is a major decision in any server purchase, SMBs must also consider cost. The CAPEX of purchasing gear is unavoidable, but how does the choice of server model affect software licensing?
To answer this, we use pricing as of June 30, 2023. Let’s first look at the operating system software licensing. For Windows Server 2022 Datacenter edition, customers can purchase core-based licensing in 16-core packs for $6,155.28 In our testing, each previous- and current-generation server contained one 32-core processor. Therefore, if a customer were purchasing new OS licenses for either environment, they would need two of these license packs, for a total of $12,310 per server ($36,930 per cluster).
Next, let’s look at SQL Server 2022 Enterprise licensing costs. In a virtualized environment, customers have two choices: They can license all cores on a server or, if they are enrolled in the Software Assurance program, they can license by the number of vCPUs per SQL Server VM. Enrolling in the Software Assurance program offers several advantages, including software upgrades at no additional cost. Because our performance testing used only a fraction of the CPU threads for SQL Server, we are assuming enrollment in Software Assurance and using the vCPU-based pricing. Each test server had two SQL Server VMs with 10 vCPUs each, for a total of 20 vCPUs needing licenses, or 60 vCPUs per three-node cluster. SQL Server Enterprise comes in a two-core pack for $15,123.29 Each cluster would need 30 of these licenses, for a total of $453,690.
As Table 4 shows, the total cost to license three servers is $613,275. Dividing this figure by three gives us $204,425, the total per-server licensing cost. After the first year, annual Software Assurance costs for a single server would be $40,885.
Table 4: Licensing and software assurance costs as of July 14, 2023.
Licensing
Price of one package
Number of packages required per 32-core server with 20 vCPUs for SQL Server VMs
Licensing costs per server
Licensing costs per three-server cluster
Windows Server 2022 Datacenter (16-core package)30
$6,155
2
$12,310
$36,930
SQL Server 2022 Enterprise (2-core/vCPU package)31
$15,123
10
$151,230
$453,690
Subtotal for software
Not applicable
Not applicable
$163,540
$490,620
Software Assurance for 1 year (25% of software cost)32
Not applicable
Not applicable
$40,885
$122,655
Total with Software Assurance 1 year for three servers
Not applicable
Not applicable
Not applicable
$613,275
Total with Software Assurance 1 year for one server
Not applicable
Not applicable
Not applicable
$204,425
The remaining workloads used open-source software such as Ubuntu, WordPress, and Tanzu Community Edition, which are all free. While numerous support and security packages are available for these open-source solutions, we are excluding them from this analysis.
The costs above assume that customers are purchasing the license as a part of their CAPEX investment. However, customers can also choose to transfer licenses from existing servers and continue paying annual OPEX fees related to the software. As we mentioned earlier, we assume customers are enrolled in the Microsoft Software Assurance program, which provides the added benefit of fine-tuning the licensing costs related to SQL Server by licensing vCPUs instead of whole CPUs, as well as the benefit to upgrade to major software versions at no additional cost. A ComputerWorld article discusses the many additional benefits to the program.
In our cost analysis, we include Software Assurance for both Windows Server and SQL Server. The annual cost of Software Assurance for enterprise software is 25 percent of licensing costs.33 In our comparison, the total licensing costs for each of our test clusters is $490,620, which would incur an annual fee of $122,655 if the company chose to maintain the licenses with Software Assurance. This annual fee, like all the licensing fees we have discussed, is identical for the previous-generation cluster and the current- generation cluster.
About the Broadcom Ethernet controllers in our test servers
Our testing used Broadcom Gigabit Ethernet BCM5720 and Broadcom 57414 Dual Port 10/25GbE SFP28 NICs.
The BCM5720 Dual-Port 1GBASE-T PCIe 2.1 Ethernet Controller is a 13th generation 10/100/1000BASE-T Ethernet LAN controller solution. According to Broadcom, the BCM5720 “provides a PCI Express® v2.0-compliant host interface, which can operate at 5 GT/s or at 2.5 GT/s at x2 link width.” It also has “I/O Virtualization (IOV) support for VMWare® NetQueue and Microsoft® VMQ” and also supports Energy Efficient Ethernet.34
The BCM 57414 Dual Port 10/25GbE SFP28 controller features two network interface ports that support both SFP28 for 25Gb/s speeds and SFP+ for 10Gb/s modules. According to Broadcom, these NICs are ideal for supporting both on-premises data centers and cloud computing backends. The BM57414 also supports advanced networking features such as SR-IOV, vSwitch acceleration, TruFlow™ flow processing, and RDMA over converged Ethernet (RoCE), the last of which we used for our Storage Spaces Direct backend.35
How improved performance can lead to needing fewer servers, which in turn reduces licensing costs
Earlier, we discussed how the superior performance of the Dell PowerEdge R7615 on our mixed workload could improve business outcomes by delivering a speedier experience for end users, whether they are employees or current or potential customers. We then looked at licensing costs and saw that an equal number of previous-generation Dell PowerEdge R7515 servers and current-generation Dell PowerEdge R7615 servers would have the same per-server cost for Windows Server, SQL Server, and Software Assurance.
Another enormous potential benefit of choosing the current-generation Dell PowerEdge R7615 is the savings that result from a lower server count. Being able to perform a given amount of work with fewer servers can not only lead to savings on OPEX such as power and cooling and IT staffing resources, but it can reduce licensing costs as well.
Let’s take the performance results we saw on the SQL Server workload and use them as a rough proxy for the different performance levels of the two server models we tested and server counts a hypothetical company might require depending on which generation it chose. Based on the number of database orders per minute the highest-performing servers in each cluster achieved, we can set a performance level, such as approximately 90,000 OPM, that a company needs to achieve to meet service-level agreements or other criteria. Given this hypothetical requirement, a company could purchase only three 16G Dell PowerEdge R7615 servers rather than the four 15G Dell PowerEdge R7515 servers that would be necessary to perform the same level of work. Having one fewer server would save the company over $200,000 on the first year of licensing and Software Assurance costs and an additional $40,000 every subsequent year. This savings would be more than enough to offset the higher purchase price of the 16G Dell PowerEdge R7615 server. Additionally, the company would spend less on power and cooling and IT management time.
Table 5: Licensing and software assurance costs as of July 14, 2023.
Category
15G Dell PowerEdge R7515 server
16G Dell PowerEdge R7615 server
Difference
OPM achieved by highest-performing server in cluster
23,604
29,436
5,832
Number of servers necessary to achieve approximately 90,000 OPM
4
3
1
Licensing and Software Assurance costs for servers necessary to achieve approximately 90,000 OPM
$817,700
$613,275
$204,425
Conclusion
As you do your best to balance timing, budget, IT resources, and your current and anticipated server needs, consider how opting for newer servers could help your business. As our testing showed, there are clear benefits to choosing servers that support such workload requirements as keeping databases running at a quick pace and delivering speedy hosting for your business’s website. Plus, a solution that offers the capacity and software features to perform well while natively supporting Kubernetes containers could add value in terms of setup, flexibility, scalability, and cost-effectiveness. And you can achieve all of this and possibly reduce OPEX in the process.
In our testing with a mixed workload that reflects some of the needs common to small and medium businesses, a cluster of 16G Dell PowerEdge R7615 single-socket servers powered by 4th Gen AMD EPYC processors outperformed a cluster of previous-generation 15G Dell PowerEdge R7515 servers, with improvements of up to 27 percent and latency reduction of up to 50 percent. These results show that upgrading to the new Dell solution can be a smart step toward meeting the needs of your users now and in the years to come.
This project was commissioned by Dell Technologies.
August 2023
Principled Technologies is a registered trademark of Principled Technologies, Inc.
All other product names are the trademarks of their respective owners.
Principled Technologies disclaimer
Principled Technologies is a registered trademark of Principled Technologies, Inc. All other product names are the trademarks of their respective owners.
DISCLAIMER OF WARRANTIES; LIMITATION OF LIABILITY: Principled Technologies, Inc. has made reasonable efforts to ensure the accuracy and validity of its testing, however, Principled Technologies, Inc. specifically disclaims any warranty, expressed or implied, relating to the test results and analysis, their accuracy, completeness or quality, including any implied warranty of fitness for any particular purpose. All persons or entities relying on the results of any testing do so at their own risk, and agree that Principled Technologies, Inc., its employees and its subcontractors shall have no liability whatsoever from any claim of loss or damage on account of any alleged error or defect in any testing procedure or result.
In no event shall Principled Technologies, Inc. be liable for indirect, special, incidental, or consequential damages in connection with its testing, even if advised of the possibility of such damages. In no event shall Principled Technologies, Inc.’s liability, including for direct damages, exceed the amounts paid in connection with Principled Technologies, Inc.’s testing. Customer’s sole and exclusive remedies are as set forth herein.

 Twitter
 Facebook
 LinkedIn
 Email
Email