A Principled Technologies report: Hands-on testing. Real-world results.
The 16th Generation Dell PowerEdge R760 server with Broadcom NICs: Save money, do more work, and use less energy
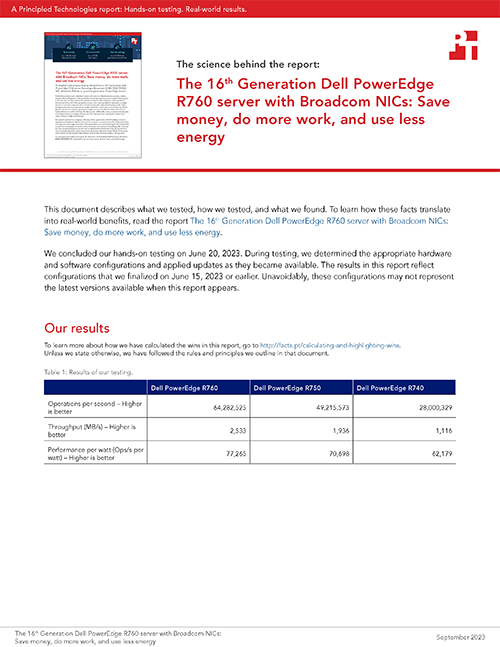
Principled Technologies testing showed that a 16th Generation Dell PowerEdge R760 server featuring a Broadcom BCM57508-P2100G NIC delivered all three vs. previous-generation PowerEdge servers
The last 20 years have seen a dramatic increase in the amount of data businesses generate, analyze, and store. During this period of data proliferation, businesses gained access to a wealth of new sources of data from the rise of the internet, the widespread adoption of smart phones, and the growth of the internet of things (IoT). More powerful processors have made it possible for businesses to analyze this data in new ways using tools such as machine learning (ML) and artificial intelligence (AI). These developments mean many organizations need to add servers to their data centers to keep up with the growth in demand for compute capacity and storage, but it can be difficult to balance the need for higher performance and the challenge of reducing costs. Additionally, energy conservation has become increasingly important as energy costs have risen and businesses have made goals to reduce their carbon footprint to fight climate change.
We tested the performance and power efficiency of three generations of Dell PowerEdge servers to help businesses understand which of these servers to choose to meet the demands of data proliferation, reducing costs, and energy conservation. This report outlines our test methodologies and findings in the context of an increasingly cost-sensitive and conservation-conscious business landscape. We measured the Ops/s and the performance per watt ratio using the Memtier benchmark utility. We ran write and read commands against the popular open-source, in-memory data structure store Redis. Common use cases of Redis include message broker software1 and real-time streaming analytics,2 among others.
Our testing showed that by choosing the 16th Generation Dell PowerEdge R760 featuring a Broadcom BCM57508-P2100G NIC, organizations can save more money, do more work, and use less energy.
Spend less to do the same amount of work with Dell PowerEdge R760 servers with Broadcom NICs
When looking at adding capacity, using the latest servers can boost performance, but as with any business decision, organizations should weigh the costs as well as the benefits associated with purchasing the latest equipment. Perhaps an organization has reasons they may consider equipment that is one or two generations back, say, to match existing equipment. However, this decision can be critical to both purchase and ongoing costs. To understand how much you can reduce costs by using the latest more powerful and more energy efficient servers, we obtained list pricing for the configurations we tested.3 We configured the servers in these price comparisons as closely as possible to those we tested, but some minor differences were unavoidable because of product availability.
The PowerEdge R760 with a Broadcom NIC processed 2.29 times as many Ops/s as the PowerEdge R740 at a cost that is 13.7 percent lower. As Figure 1 shows, the PowerEdge R760 processed 166.1 percent more Ops/s per Dollar as the PowerEdge R740. In addition to the lower purchase price, the PowerEdge R760 was 24.2 percent more energy efficient in our tests, which could further reduce costs by requiring less energy for operation and cooling.
The PowerEdge R760 with a Broadcom NIC processed 30.6 percent more Ops/s than the PowerEdge R750 at a cost that is only 3.9 percent higher. The cost difference between the PowerEdge R750 and the PowerEdge R760 is relatively small compared to the difference in performance, and as Figure 2 shows, the PowerEdge R760 server offered 25.4 percent more Ops/s per US dollar than the PowerEdge R750.
The impact of these cost, energy efficiency, and performance numbers will vary depending on the needs of a given data center. Let’s examine what the performance and value of these servers would look like in several scenarios.
The Ops/s that the servers processed, the price of the servers in US dollars, and the Ops/s per US dollar of the servers. Higher Ops/s per US dollar is better. Source: Principled Technologies.The Ops/s that the servers processed, the price of the servers in US dollars, and the Ops/s per US dollar of the servers. Higher Ops/s per US dollar is better. Source: Principled Technologies.
If an organization needed the additional database processing power of 10 PowerEdge R760 servers, they could meet those needs with any of the servers we tested, but they would spend the least ($318,236.20) if they bought 10 PowerEdge R760 servers. To meet those needs with the PowerEdge R750 servers, they’d spend $399,181.54, and with the PowerEdge R740 servers, they’d pay $847,046.62.
A comparison of how many servers it would take to do the same work as 10 Dell PowerEdge R760 servers and the cost in USD. Source: Principled Technologies.
The savings scale with the size of an organization’s database processing needs: 500 PowerEdge R760 servers would cost $15,911,810.00 and process 32,141,262,500 Ops/s. To do the same amount of work, the organization would need to purchase approximately 653 PowerEdge R750 servers, which would cost $19,956,907.00: over $4 million US dollars more than choosing the PowerEdge R760. Using this same hypothetical, an organization would need to purchase approximately 1,147 PowerEdge R740 servers to do the work of 500 PowerEdge R760 servers, at a cost of $42,319,539.95: over $26 million US dollars more than choosing the PowerEdge R760.
When you consider the higher performance, the savings discussed above, and the lower energy costs of the more efficient PowerEdge R760 with a Broadcom NIC, it becomes clear that organizations will save the most money by choosing the latest-generation Dell PowerEdge R760 server.
Better performance with the Dell PowerEdge R760 server
Bytes per second and operations per second (Ops/s) are both measures of throughput, or rates. Bytes per second are a system level statistic that typically come from either disk or network. We often refer to this metric in terms of a multiplier, such as megabytes per second (MB/s) or gigabytes per second (GB/s). In the case of our testing, we measured MB/s that passed through the ethernet controller. Ops/s typically refers to an application measure, in this case the operations per second that Redis processed during our memtier tests. Both measures of throughput are important to consider depending on what you are trying to measure. An increase in either number shows improvement in the amount of data (MB/s) or operations (Ops/s) that the server or application processed in a fixed amount of time.
When we compared the throughput of the three Dell PowerEdge servers, we found that the PowerEdge R760 server offered up to 126.9 percent more MB/s throughput and processed up to 129.5 percent more Ops/s than the PowerEdge R740 server. The PowerEdge R760 offered up to 30.8 percent more MB/s throughput and processed up to 30.6 percent more Ops/s than the previous-generation PowerEdge R750 server. Organizations that want the highest performing server should consider the PowerEdge R760, based on these findings.
The Ops/s the servers processed. Higher is better. Source: Principled Technologies.The throughput of the servers in MB/s. Higher is better. Source: Principled Technologies.The performance per watt of the servers in Ops/s per watt. Higher is better. Source: Principled Technologies.
Save money by getting more performance per watt with the PowerEdge R760 server featuring a Broadcom NIC
To understand the power efficiency of the servers, we measured the work a server did (Ops/s), and divided it by the power the server used (watts). We found that the PowerEdge R760 with a Broadcom NIC offered up to 24.2 percent better operations per second per watt than the 14th Generation Dell PowerEdge R740 server, and up to 9.2 percent better operations per second per watt than the 15th Generation Dell PowerEdge R750 server. Organizations that select these new servers with Broadcom ethernet controllers can reduce the amount of power necessary to process a given unit of work, which will help reduce their energy costs and carbon footprint.
Our hands-on testing of the Dell PowerEdge R760
To help organizations understand which PowerEdge server best meets their needs, we ran a series of tests comparing the performance and power efficiency of three servers that Dell is currently selling:
16th Generation Dell PowerEdge R760
15th Generation Dell PowerEdge R750
14th Generation Dell PowerEdge R740
These results might also be helpful for organizations considering upgrading their older servers to the latest-generation PowerEdge R760.
For testing, we used the database Redis, a widely-used, in-memory, open-source key-value store—a type of NoSQL database that uses pairs of keys and associated values to quickly access information. Companies including Twitter, GitHub, Snapchat, Craigslist, and StackOverflow rely on Redis for their operations.4
Dell PowerEdge R760 servers with Broadcom BCM57508-P2100G NICs
The Dell PowerEdge R760 server is a 2U, two-socket server that features a Broadcom BCM57508-P2100G Dual-Port 100GbE PCl Ethernet Controller. Dell designed the PowerEdge R760 to handle “demanding workloads including artificial intelligence, database analytics, and high-density virtualization.”5A wide range of businesses can use the PowerEdge R760 for workloads that demand high performance, such as:
Artificial intelligence
Virtualized workloads
Machine learning
Database analysis
According to Dell, users of the PowerEdge R760 server can:
“Add up to two 4th generation Intel® Xeon® scalable processors with up to 56 cores for fast and accurate performance
Accelerate in-memory workloads with up to 32 DDR5 RDIMMS up to 4800 MT/s(1DPC)
Maximize performance with up to 2x double-wide or 6x single-wide GPUs for finishing workloads faster
[Use the] new Smart Flow chassis to air-cool some of the highest core count CPUs within current IT infrastructure”6
The PowerEdge R760 server includes built-in security features such as secured component verification, signed firmware and drift detection, dynamic system lockdown, and BIOS recovery.7The PowerEdge R760 also features intelligent automation features such as OpenManage Enterprise, CloudIQ solutions, and PowerEdge iDRAC.The OpenManage systems management portfolio enables administrators to deploy, configure, monitor, and manage PowerEdge servers, including easily obtaining power data and capping power as necessary. For more information about the Dell PowerEdge R760 server, visit: https://www.dell.com/en-us/shop/productdetailstxn/poweredge-r760.
In the case of traditional relational databases, the architecture is such that the designers of the database must model, or structure, the data in a certain way. When applications request data and the data is not in memory, the database must retrieve the data from disk, causing a small delay. This architecture works well for some applications, but not all. In many types of applications, a developer may need to store data with less structure—perhaps strings, hashes, lists, or arrays. Redis works well for this, as its architecture is based on a key and a value. A key can have multiple values, resulting in databases that are comprised of a long list of keys and their associated values, with the potential for fewer complexities and slowdowns of relational databases. This data design makes Redis useful for web application user session data (such as cookies) and other small elements of data that web server applications need frequently. Caching that data in Redis allows web applications to return data very quickly.
Memtier, the benchmark utility we used, is a utility that runs set (write) and get (read) commands against a Redis database. Those commands simulate different request patterns. According to Redis, the memtier_benchmark is “a high-throughput benchmarking tool” that can “generate various traffic patterns against both Memcached and Redis instances.”8 Various parameters that the operator can use, such as data size and key-pattern, can alter the traffic pattern that memtier returns. By operating the memtier utility on a client server and targeting a Redis server, we utilized the Redis server’s processor and ethernet controller subsystems heavily.
About the Broadcom BCM57508-P2100G Dual-Port 100GbE PCle 4.0 ethernet controller
A network interface controller (NIC) is a hardware component in a server that connects the server to a network. The NIC translates outgoing data from the server into a format that the network can read and translates incoming data from the network into a format that the server can read. A higher performing NIC can reduce latency, increase throughput, and allow the server to transmit and receive a great volume of data.
The Dell PowerEdge R760 features the Broadcom BCM57508-P2100G Dual-Port 100GbE PCle 4.0 ethernet controller, which supports speeds of up to 200 Gigabits per second. Broadcom designed the BCM57508-P2100G “to build highly-scalable, feature-rich networking solutions in servers for enterprise and cloud-scale networking and storage applications, including high-performance computing, telco, machine learning, storage disaggregation, and data analytics.”9
The BCM57508-P2100G features TruFlow™, which Broadcom asserts can “increase VM density up to 50 percent.”10The BCM57508-P2100G also features BroadSAFE® technology, “to provide unparalleled platform security” and a “unique set of highly-optimized hardware acceleration engines to enhance network performance and improve server efficiency.”11
We configured all three of the servers we tested with Red Hat Enterprise Linux 8.7 and the most recent firmware as of March 14th, 2023 for the PowerEdge R740 and PowerEdge R750, and April 6th, 2023 for the PowerEdge R760. We recorded the operations per second (Ops/s) and throughput (MB/s) during the test and used those readings for our results. We used an external power meter to measure the power draw by the power supply units (PSUs) while the servers were under load and recorded the average power draw for the entire duration of the test. Then, we calculated the power efficiency (Ops/s/watt) of the devices using the results of our testing. We wanted to utilize close to 100 percent of the database server’s CPU capacity to see how the systems performed under stress. We used the memtier_benchmark to create a roughly 100GB database and ran a constant size, 32 byte (default/small), 100 percent read workload to create enough load to reach nearly 100 percent CPU usage. Read-only operations constitute the majority of the workload in applications such as content streaming and data analysis. Additionally, testing with read-only operations provides comparable performance metrics without the additional complexity of write operations.
Efficiency and expansion: Unraveling the challenges of the growing data center market
We’ve shown that the PowerEdge R760 is more energy-efficient and offers better performance than previous-generation PowerEdge servers, but why does that matter? Organizations realize the value of their data and the insights they provide. Despite economic uncertainty, spending on servers has remained consistent with previous years, and many experts expect it to increase.12 According to one industry analyst, “despite the general tightening of spending by governments and corporations..., organizations are still spending on infrastructure even if they are, in some cases, cutting back on personnel.”13 Increasingly, to deal with the ever growing importance of their data, businesses are aware that adopting new technologies such as ML and AI is “both a necessity and a race.”14
While the new 16th Generation server we tested uses more power, it does so more efficiently—in this example resulting in an approximately 20 percent lower annual cost, based on the following calculations. In our example if we factor in power usage, our tested 16th Generation server used approximately 831W (.831kW), while the 14th Generation server used approximately 450W (.450kW). In an earlier section we established that an organization would need 1,147 PowerEdge R740 servers to do the work of 500 PowerEdge R760 servers. Thus we can calculate the data center power cost per year as follows:
Calculations showing the annual power cost of the servers in US dollars. Lower is better. Source: Principled Technologies.
Sustainability challenges
As new technologies and data proliferation have increased the demands on data center performance and capacity, sustainability concerns have begun to put pressure on companies to increase the efficiency and reduce the carbon footprint of their data centers. By some estimates, the carbon footprint of data centers worldwide equals that of the airline industry.16 According to S&P Global Market Intelligence, “the data center industry faces pressure from multiple sources— including government, financial markets, and corporate clients—to improve sustainability and reduce carbon emissions.”17Over the last few years, businesses have contended with volatile energy prices that have trended higher.18 For many companies, the energy consumption of their servers is a significant expense.19
The sustainability challenges related to data centers are not limited to carbon emissions. Many data centers use large amounts of water to cool their servers. According to the U.S. Department of Energy, an average data center that uses evaporative cooling can consume 3 to 5 million gallons of water per day— similar to the daily capacity of a city of 30,000-50,000 people.20 Roughly 20 percent of data centers in the U.S. rely on watersheds that are under stress from drought.21 Choosing more efficient servers can help organizations meet internal and external climate goals and reduce their water usage and carbon footprints.
Managing costs over time
So far in this report we have explained why choosing the PowerEdge R760 to meet new capacity needs can save money and provide better performance, but what about organizations considering upgrading to newer, more efficient servers? In addition to the savings associated with reducing cooling costs, businesses that upgrade older servers may also save money by avoiding some of the other costs associated with delaying their server replacements. Older servers become more expensive to operate as they age. According to analysis by IDC, businesses reported an average annual operating cost of $7,541 per server during the first three years of use; during years 4 to 6, those servers reached a high of an average of $22,511 per server, a 199 percent increase.22 Upgrading aging servers can reduce the amount of time IT spends on compliance, maintenance, and security, as newer servers often include the most recent manageability and security features. Aging servers may also contribute to slower response times and a diminished customer experience. Research by Deloitte found that “with a 0.1s improvement in site speed…consumers spent almost 10 percent more” on retail sites.23 Upgrading to the latest-generation server technology can provide a better user experience.
Historically, server manufacturers have improved the performance of their systems in parallel with the growing demand for data processing, but the ever increasing reliance on data processing plus the rapid growth of resource-hungry technologies such as ML and AI have combined to make data center processing and power consumption challenges even more urgent. ML and AI workloads require a large amount of processing power, and therefore can lead to data centers running at higher power densities, which creates more demand on cooling systems. Some analysts estimate the use of ML will grow at a compound annual growth rate of 35.6 percent until 2030.24 Data centers will need more powerful, more energy-efficient systems to keep up with this growing demand.
According to the International Monetary Fund (IMF), “energy prices surged to near historic highs in recent years amid the pandemic and the war in Ukraine.”25 In their latest World Economic Outlook forecast, the IMF predicted “that growth will slow from 3.4 percent last year to 2.8 percent this year.”26 Faced with volatile energy prices and growing economic uncertainty, many organizations are looking for ways to lower computing costs without sacrificing performance. Organizations can potentially gain performance and reduce cooling costs by upgrading their servers to more powerful models that consume less energy under load. Upgrading to more efficient servers can also help businesses meet their climate change goals.
Server power consumption
In the last two decades, server capabilities have increased dramatically, becoming more powerful and more efficient. While businesses have benefited from the advanced analytics and data processing capabilities of these new servers, they have come at a cost due to the energy required to run them. The design of a server and its components determine how much power it will consume during operation.
Thermal design power
Thermal design power (TDP) refers to the maximum theoretical amount of power, measured in watts, a computer chip (typically a processor or peripheral component) uses.
TDP can be a helpful starting point in considering what the total power draw of a server could be or what power supplies the server should be equipped with. Using these wattage approximations and other server energy usage information, data center designers can calculate the approximate British Thermal Units (BTUs) a data center will need for cooling. Because of advancements in technology and performance such as increased core count, the TDP of many processors has doubled in the last few years, making power considerations even more significant.27
Key factors in server design that affect power consumption
Multiple factors in server design affect power consumption. In many servers, the central processor uses more power than other components. Based on some models, the processor can consume as much as 32 percent of the server’s power.28 A study by the Swedish Energy Agency examined data center and server energy consumption and found, “the central processing unit (CPU) is the largest contributor to the total server power consumption, followed by peripheral slots (including network card slot and input and output devices (I/O) devices), conduction losses, memory, motherboard, disk/storage, and cooling fan.”29
CPUs are, of course, not the only components that require power. Every component in a server consumes power, from disks to graphics processing units (GPUs) to power supply units (PSUs), and can therefore impact the server’s power efficiency. Adding more disks or GPUs might increase the server’s power consumption, while using fewer disks or no GPUs might decrease it. Similarly, using a higher efficiency power supply can reduce a server’s power consumption—according to one source, by 3 to 4 percent.30
The NIC also has an impact on the power consumption of a server. Based on the specifications Broadcom lists for the NICs in the servers we tested, the 100Gb Broadcom BCM957508-P2100G NIC in the PowerEdge R760 typically draws 16.0W and the 25Gb BCM957414-P225p NIC in the PowerEdge R740 typically draws 10.9W with Passive DAC at 55°C ambient temperature.31 This means that choosing the PowerEdge R760 instead of the PowerEdge R750 would provide a NIC with four times the raw capacity that draws less than 50 percent more power. Based on the specifications Broadcom lists for a 10Gb BCM57712 NIC with the same configuration as the one in the PowerEdge R740 we tested, we estimate that selecting the PowerEdge R760 over the PowerEdge R740 would provide a NIC with ten times the raw capacity that draws less than 80 percent more power.32
Data center cooling
Cooling is critical to a data center’s operation because poorly managed heat can lead to “downtime, damage to critical components, and a shorter lifespan for equipment.”33A data center’s cooling generally falls into two categories: direct cooling of the servers and cooling the data center floor. Inside the servers, cooling technologies focus on moving the heat that the server generates away from the devices. On the data center floor, cooling technologies focus on maintaining a comfortable—if warm—ambient room temperature.34
The most common cooling system data centers use is a computer room air conditioner (CRAC). A CRAC works the same way as a residential air conditioner, but is inside of a server room. The CRAC method is energy inefficient but one of the most affordable methods of data center cooling.35A more energy-efficient method of cooling a data center is evaporative cooling. However, this requires a large amount of water, so it is not always the most environmentally friendly option depending on the watershed in the location of the data center.
Dell incorporated several cooling technologies into 16th Generation PowerEdge servers to help organizations meet the demands of reducing energy costs and environmental impact. These include high-performing fans and redesigned heatsinks to improve airflow and thermal management.36 According to Dell, high airflow “is achieved using new impedance airflow paths, new storage backplane ingredients, and optimized mechanical structures all tuned to provide up to a 15% higher airflow compared to traditional designs.”37 Software solutions such as OME Power Manager will automatically adjust power usage based on policies that admins can customize. To learn more about the power management benefits of OME, visit https://www.principledtechnologies.com/Dell/OpenManage-Power-Manager-1122.pdf.
Conclusion
Organizations don’t have to choose between saving money, doing more work, and using less energy; the new 16th Generation Dell PowerEdge R760 servers with Broadcom NICs do all three. In our hands-on testing, the new 16th Generation Dell PowerEdge R760 server featuring a Broadcom NIC offered 166.1 percent more Ops/s per US dollar, 129.5 percent more Ops/s, and 24.2 percent better performance per watt than the 14th Generation Dell PowerEdge R740 server. This means the PowerEdge R760 with a Broadcom NIC did over twice as much work at a lower cost with nearly 25 percent better power efficiency than the PowerEdge R740. When compared to the 15th Generation Dell PowerEdge R750, the PowerEdge R760 processed 29.8 percent more Ops/s at a lower cost in terms of Ops/s per US dollar and offered 3.8 percent better performance per watt.
In addition to lowering cooling costs and carbon emissions, choosing the latest-generation servers can help businesses lower other operating costs, such as maintenance and security compliance. Because the latest-generation Dell PowerEdge R760 servers offer more compute capacity, fewer servers can do more work, potentially reducing licensing costs and the physical footprint of a data center. Newer servers often feature the most recent manageability and security features, which can make it easier for businesses to manage their servers and protect their data. By choosing servers with better performance, businesses can reduce the response time of their systems and provide a better user experience.
Increasingly, businesses are under pressure to reduce the energy consumption and cost of their data centers while maintaining or increasing performance. Key web technologies such as Redis can offer businesses a competitive edge, but they also require a large amount of data processing. Businesses can meet these challenges with Dell PowerEdge R760 servers with Broadcom NICs that offer better cost-efficiency, performance, and power-efficiency.
Prices obtained from Dell Marketing, US only. We used list pricing because it was the only pricing readily available for all three servers and because discounts vary.
This project was commissioned by Dell Technologies.
September 2023
Principled Technologies is a registered trademark of Principled Technologies, Inc.
All other product names are the trademarks of their respective owners.
Principled Technologies disclaimer
Principled Technologies is a registered trademark of Principled Technologies, Inc. All other product names are the trademarks of their respective owners.
DISCLAIMER OF WARRANTIES; LIMITATION OF LIABILITY: Principled Technologies, Inc. has made reasonable efforts to ensure the accuracy and validity of its testing, however, Principled Technologies, Inc. specifically disclaims any warranty, expressed or implied, relating to the test results and analysis, their accuracy, completeness or quality, including any implied warranty of fitness for any particular purpose. All persons or entities relying on the results of any testing do so at their own risk, and agree that Principled Technologies, Inc., its employees and its subcontractors shall have no liability whatsoever from any claim of loss or damage on account of any alleged error or defect in any testing procedure or result.
In no event shall Principled Technologies, Inc. be liable for indirect, special, incidental, or consequential damages in connection with its testing, even if advised of the possibility of such damages. In no event shall Principled Technologies, Inc.’s liability, including for direct damages, exceed the amounts paid in connection with Principled Technologies, Inc.’s testing. Customer’s sole and exclusive remedies are as set forth herein.


 Twitter
 Facebook
 LinkedIn
 Email
Email