BenchmarkXPRT Blog banner

Category: Benchmark metrics

Best practices in benchmarking

From time to time, a tester writes to ask for help determining why they see different WebXPRT scores on two systems that have the same hardware configuration. The scores sometimes differ by a significant percentage. This can happen for many reasons, including different software stacks, but score variability can also result from different testing behavior and environments. While a small amount of variability is normal, these types of questions provide an opportunity to talk about the basic benchmarking practices we follow in the XPRT lab to produce the most consistent and reliable scores.

Below, we list a few basic best practices you might find useful in your testing. Most of them relate to evaluating browser performance with WebXPRT, but several of these practices apply to other benchmarks as well.

  • Test with clean images: We typically use an out-of-box (OOB) method for testing new devices in the XPRT lab. OOB testing means that other than running the initial OS and browser version updates that users are likely to run after first turning on the device, we change as little as possible before testing. We want to assess the performance that buyers are likely to see when they first purchase the device, before installing additional apps and utilities. This is the best way to provide an accurate assessment of the performance retail buyers will experience. While OOB is not appropriate for certain types of testing, the key is to not test a device that’s bogged down with programs that will influence results.
  • Turn off automatic updates: We do our best to eliminate or minimize app and system updates after initial setup. Some vendors are making it more difficult to turn off updates completely, but you should always double-check update settings before testing.
  • Get a baseline for system processes: Depending on the system and the OS, a significant amount of system-level activity can be going on in the background after you turn it on. As much as possible, we like to wait for a stable (idle) baseline of system activity before kicking off a test. If we start testing immediately after booting the system, we often see higher variance in the first run before the scores start to tighten up.
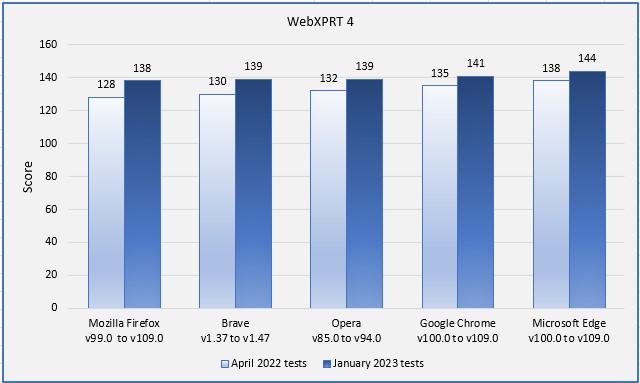
  • Hardware is not the only important factor: Most people know that different browsers produce different performance scores on the same system. However, testers aren’t always aware of shifts in performance between different versions of the same browser. While most updates don’t have a large impact on performance, a few updates have increased (or even decreased) browser performance by a significant amount. For this reason, it’s always worthwhile to record and disclose the extended browser version number for each test run. The same principle applies to any other relevant software.
  • Use more than one data point: Because of natural variance, our standard practice in the XPRT lab is to publish a score that represents the median from three to five runs, if not more. If you run a benchmark only once, and the score differs significantly from other published scores, your result could be an outlier that you would not see again under stable testing conditions.

We hope these tips will help make your testing more accurate. If you have any questions about the XPRTs, or about benchmarking in general, feel free to ask!

Justin

WebXPRT’s global reach

In our last blog post, we reflected on the 10-year anniversary of the WebXPRT launch by looking at the consistent growth in the number of WebXPRT runs over the last decade. Today, we wrap up our focus on WebXPRT’s anniversary by sharing some data about the benchmark’s truly global reach.

We occasionally update the community on some of the reach metrics we track by publishing a new version of the “XPRTs around the world” infographic. The metrics include completed test runs, benchmark downloads, and mentions of the XPRTs in advertisements, articles, and tech reviews. This information gives us insight into how many people are using the XPRT tools, and publishing the infographic helps readers and community members see the impact the XPRTs are having around the world.

WebXPRT is our most widely used benchmark by far, and is responsible for much of the XPRT’s global reach. Since February 2013, users have run WebXPRT more than 1,176,000 times. Those test runs took place in over 924 cities located in 81 countries on six continents. Some interesting new locations for completed WebXPRT runs include Rajarampur, Bangladesh; Al Muharraq, Bahrain; Manila, The Philippines; Skopje, Macedonia; and Ljubljana, Slovenia.

We’re pleased that WebXPRT has proven to be a useful and reliable performance evaluation tool for so many people in so many geographically distant locations. If you’ve ever run WebXPRT in a country that is not highlighted in the “XPRTs around the world” infographic, we’d love to hear about it!

Justin

Mobile World Congress 2023: Infrastructure led the way

When the tech industry is at its best, a virtuous cycle of capabilities and use cases chases its own tail to produce ever-better tech for us all. Faster CPUs drive new usage models, which in turn emerge and swamp the CPUs, which then must get faster. Better screens make us want higher-quality video, which requires more bandwidth to deliver and causes us to desire even better displays. Apps connect us in more ways, but those connections require more bandwidth, which leads to new apps that can take advantage of those faster connections. And on and on.

Put a finger on the cycle at any given moment, and you’ll see that while all the elements are in motion, some are the stars of the moment. To keep the cycle going, it’s crucial for these areas to improve the most. At Mobile World Congress 2023 (#MWC23), that distinction belonged to infrastructure. Yes, some new mobile phones were on display, Lenovo showed off new ThinkPads, and other mobile devices were in abundance, but as I walked the eight huge halls, I couldn’t help but notice the heavy emphasis on infrastructure.

5G, for example, is real now—but it’s far from everywhere. Telecom providers have to figure out how to profitably build out the networks necessary to support it. The whole industry must solve the problems of delivering 5G at huge scale, handle the traffic increases it will bring, switch and route the data, and ultimately make sure the end devices can take full advantage of that data. Management and security remain vital whenever data is flying around, so those softer pieces of infrastructure also matter greatly.

Inevitably and always, to know if we as an industry are meeting these challenges, we must measure performance—both in the raw speed sense and in the broader sense of the word. Are we seeing the full bandwidth we expect? Are devices handling the data properly and at speed? Where’s the bottleneck now? Are we delivering on the schedules we promised? Questions such as these are key concerns in every tech cycle—and some of them are exactly what the XPRTs focus on.

As we improve our infrastructure, we hope to see the benefits at a personal level. When you’re using a device—whether it’s a smart watch, a mobile phone, or a laptop—you need it to do its job well, respond to you quickly, and show you what you want when you want it. When your device makes you wait, it can be helpful to know if the bandwidth feeding data to the device is the bottleneck or if the device simply can’t keep up with the flow of data it’s receiving. The XPRTs can help you figure out what’s going on, and they will continue to be useful and important as the tech cycle spins on. If history is our guide, the infrastructure focus of MWC23 will lead to greater capabilities that require even better devices down the line. We look forward to testing them.

Comparing the performance of popular browsers with WebXPRT 4

If you’ve been reading the XPRT blog for a while, you know that we occasionally like to revisit a series of in-house WebXPRT comparison tests to see if recent updates have changed the performance rankings of popular web browsers. We published our most recent comparison last April, when we used WebXPRT 4 to compare the performance of five browsers on the same system.

For this round of tests, we used a Dell XPS 13 7930, which features an Intel Core i3-10110U processor and 4 GB of RAM, running Windows 11 Home updated to version 22H2 (22621.1105). We installed all current Windows updates, and updated each of the browsers under test: Brave, Google Chrome, Microsoft Edge, Mozilla Firefox, and Opera.

After the update process completed, we turned off updates to prevent them from interfering with test runs. We ran WebXPRT 4 three times on each of the five browsers. The score we post for each browser is the median of the three test runs.

In our last round of tests, Edge was the clear winner, with a 2.2 percent performance advantage over Chrome. Firefox came in last, about 3 percent slower than Opera, which was in the middle of the pack. With updated versions of the browsers, the only change in rank order was that Brave moved into a tie with Opera.

While the rank order from this round of tests was very similar to the previous round, we did observe two clear performance trends: (1) the range between high and low scores was tighter, dropping from a difference of 7.8 percent to 4.3 percent, and (2) every browser demonstrated improved performance. The chart below illustrates both trends. Firefox showed the single largest score improvement at 7.8 percent, but the performance jump for each browser was considerable.

Do these results mean that Microsoft Edge will always provide a speedier web experience, or Firefox will always be slower than the others? Not necessarily. It’s true that a device with a higher WebXPRT score will probably feel faster during daily web activities than one with a much lower score, but your experience depends in part on the types of things you do on the web, along with your system’s privacy settings, memory load, ecosystem integration, extension activity, and web app capabilities.

In addition, browser speed can noticeably increase or decrease after an update, and OS-specific optimizations can affect performance, such as with Edge on Windows 11 and Chrome on Chrome OS. All these variables are important to keep in mind when considering how WebXPRT results translate to your everyday experience.

Have you used WebXPRT to compare browser performance on the same system? Let us know how it turned out!

Justin

We want your thoughts about experimental WebXPRT 4 workloads

Two weeks ago, we discussed how users can automate WebXPRT 4 testing by appending several parameters and values to the benchmark’s URL. One of these lets you enable any available experimental workloads during the test run. While we don’t currently offer any experimental workloads for WebXPRT 4, we are seeking suggestions for possible future workload scenarios, or specific web technologies that you’d like to be able to test with an experimental workload.

The main purpose of optional, experimental workloads would be to test cutting-edge browser technologies or new use cases, even if the experimental workload doesn’t work on all browsers or devices. The individual scores for the experimental workloads would stand alone, and would not factor in the WebXPRT 4 overall score. WebXPRT 4 testers would be able to run the experimental workloads one of two ways: by adjusting a value in the WebXPRT 4 automation scripts, as mentioned above, or by manually selecting them on the benchmark’s home screen.

Testers would benefit from experimental workloads by learning how well certain browsers or systems handle new tasks (e.g., new web apps or AI capabilities). We would benefit from fielding workloads for large-scale testing and user feedback before we commit to including them as core WebXPRT workloads.

Do you have any general thoughts about experimental workloads for browser performance testing, or any specific workloads that you’d like us to consider? Please let us know.

Justin

Looking forward to an important WebXPRT milestone

February 28, 2013 was a momentous day for the BenchmarkXPRT Development Community. On that day, we published a press release announcing the official launch of the first version of the WebXPRT benchmark, WebXPRT 2013. As difficult as it is for us to believe, the 10-year anniversary of the initial WebXPRT launch is in just a few short months!

We introduced WebXPRT as a truly unique browser performance benchmark in a field that was already crowded with a variety of measurement tools. Since those early days, the WebXPRT market presence has grown from a small foothold into a worldwide industry standard. Over the years, hundreds of tech press publications have used WebXPRT in thousands of articles and reviews, and the WebXPRT completed-runs counter rolled over the 1,000,000-run mark.

New web technologies are continually changing the way we use the web, and browser-performance benchmarks should evaluate how well new devices handle the web of today, not the web of several years ago. While some organizations have stopped development for other browser performance benchmarks, we’ve had the opportunity to continue updating and refining WebXPRT. We can look back at each of the four major iterations of the benchmark—WebXPRT 2013, WebXPRT 2015, WebXPRT 3, and WebXPRT 4—and see a consistent philosophy and shared technical lineage contributing to a product that has steadily improved.

As we get closer to the 10-year anniversary of WebXPRT next year, we’ll be sharing more insights about its reach and impact on the industry, discussing possible future plans for the benchmark, and announcing some fun anniversary-related opportunities for WebXPRT users. We think 2023 will be the best year yet for WebXPRT!

Justin

Check out the other XPRTs:

Forgot your password?